Ember Climate MCP Server
Access global electricity data — generation, demand, emissions, and capacity from Ember Climate's open energy API.
Vinkius AI Gateway prend en charge le streamable HTTP et le SSE.

Fonctionne avec tous les agents IA que vous utilisez déjà
…et tout client compatible MCP
Ember Climate MCP Server : voyez votre AI Agent en action
Capacités intégrées (11)
get_api_options
Use dataset (e.g., "electricity-generation"), temporal_resolution (e.g., "monthly", "yearly"), and filter_name (e.g., "entity", "series", "entity_code", "date", "year"). This tool is useful for discovering valid country codes, energy source types, and available date ranges before making specific data queries. Get available filter options for Ember electricity datasets
get_carbon_intensity_monthly
Use entity or entity_code to filter by country (e.g., "Brazil", "DE", "US"). Use start_date and end_date with format YYYY-MM (e.g., "2023-01", "2024-12"). This helps analyze seasonal patterns in grid carbon footprint and track monthly decarbonization progress. Get monthly carbon intensity of electricity generation for countries/regions
get_carbon_intensity_yearly
Use entity or entity_code to filter by country (e.g., "Brazil", "DE", "US"). Use start_date and end_date with format YYYY (e.g., "2020", "2023"). Returns emissions intensity data showing how clean or polluting the electricity grid is over time. Get yearly carbon intensity of electricity generation for countries/regions
get_electricity_demand_monthly
Use entity or entity_code to filter by country (e.g., "Brazil", "DE", "US"). Use start_date and end_date with format YYYY-MM (e.g., "2023-01", "2024-12"). Useful for analyzing seasonal demand patterns, peak consumption periods, and demand forecasting. Get monthly electricity demand data for countries/regions
get_electricity_demand_yearly
Use entity or entity_code to specify countries (e.g., "Brazil", "DE", "US"). Use start_date and end_date with format YYYY (e.g., "2020", "2023"). Essential for understanding energy consumption trends and comparing per-capita usage across nations. Get yearly electricity demand data for countries/regions
get_electricity_generation_monthly
). Returns generation in TWh and percentage share of total generation for each source. Use entity or entity_code to filter by country (e.g., "Brazil", "DE", "US"). Use start_date and end_date with format YYYY-MM (e.g., "2023-01", "2024-12"). Use series to filter by specific energy sources (e.g., "coal", "wind", "solar", "hydro", "nuclear", "gas"). Perfect for analyzing seasonal generation patterns, renewable intermittency, and monthly energy mix changes. Get monthly electricity generation by source for countries/regions
get_electricity_generation_yearly
). Returns generation in TWh and percentage share of total generation for each source. Use entity or entity_code to filter by country (e.g., "Brazil", "DE", "US"). Use start_date and end_date with format YYYY (e.g., "2020", "2023"). Use series to filter by specific energy sources (e.g., "coal", "wind", "solar", "hydro", "nuclear", "gas"). Essential for analyzing energy transition, renewable adoption, and fossil fuel phase-out progress. Get yearly electricity generation by source for countries/regions
get_generation_multi_entity
g., "BRA,DE,US" for Brazil, Germany, and United States). Use start_date and end_date with format YYYY for yearly or YYYY-MM for monthly data. Use series to filter by energy source (e.g., "coal", "wind", "solar", "hydro", "nuclear", "gas"). This is highly efficient for comparative analysis across multiple nations without making separate API calls. Example: entity_code="BRA,DE,US,CHN,IND" to compare BRICS+ nations energy generation. Get electricity generation data for multiple countries simultaneously
get_installed_capacity_monthly
Use entity or entity_code to filter by country (e.g., "Brazil", "DE", "US"). Use start_date and end_date with format YYYY-MM (e.g., "2023-01", "2024-12"). Use series to filter by capacity type (e.g., "wind", "solar"). Tracks renewable infrastructure deployment and capacity growth over time across different nations. Get monthly installed power capacity (wind and solar) for countries
get_power_sector_emissions_monthly
Use entity or entity_code to filter by country (e.g., "Brazil", "DE", "US"). Use start_date and end_date with format YYYY-MM (e.g., "2023-01", "2024-12"). Use series parameter to filter by emission types (e.g., "co2"). Enables granular tracking of monthly emission trends and seasonal variations in power sector pollution. Get monthly power sector CO2 emissions for countries/regions
get_power_sector_emissions_yearly
Use entity or entity_code to filter by country (e.g., "Brazil", "DE", "US"). Use start_date and end_date with format YYYY (e.g., "2020", "2023"). Use series parameter to filter by emission types (e.g., "co2"). Critical for tracking national decarbonization progress and climate policy effectiveness. Get yearly power sector CO2 emissions for countries/regions
Ce que ce connecteur débloque
Connect your AI agents to Ember Climate's open electricity dataset and gain instant access to global energy intelligence covering over 200 countries and regions.
What you can do
- Carbon Intensity Analysis — Track yearly and monthly carbon footprint (gCO2/kWh) of electricity grids worldwide
- Generation by Source — Break down electricity production by energy type: coal, gas, nuclear, wind, solar, hydro, and more
- Demand Trends — Analyze electricity consumption patterns in TWh with per-capita metrics across nations
- Power Sector Emissions — Monitor CO2 emissions from the power sector in megatonnes and percentage shares
- Renewable Capacity Tracking — Follow monthly wind and solar capacity installations in GW to measure clean energy deployment
- Multi-Country Comparison — Query multiple nations simultaneously using comma-separated country codes for comparative analysis
- Filter Discovery — Explore available entities, energy sources, and date ranges dynamically before making targeted queries
How it works
1. Subscribe to this server
2. Enter your Ember Climate API Key (free, obtained via email signup)
3. Start querying global electricity data from Claude, Cursor, or any MCP-compatible client
No more manual CSV downloads or spreadsheet wrangling. Your AI becomes an instant energy analyst, capable of answering complex questions about the global energy transition in seconds.
Who is this for?
- Climate Researchers — instantly retrieve emissions data and grid carbon intensity trends without writing data pipelines
- Energy Consultants — compare generation mixes across countries and track renewable adoption rates programmatically
- Sustainability Teams — monitor power sector decarbonization progress and contextualize corporate ESG goals against national benchmarks
- Policy Makers & Journalists — fact-check energy claims with authoritative data from over 200 geographies on demand
Questions fréquemment posées
Donnez à vos agents IA la puissance de Ember Climate
Accédez à Ember Climate et à plus de 2 000 serveurs MCP — prêts à être utilisés par vos agents, dès maintenant. Pas de code glue. Pas d'intégrations personnalisées. Branchez simplement Vinkius AI Gateway et laissez vos agents travailler.
Plus dans cette catégorie
Ambee Soil
5 outilsAccess real-time soil data via Ambee — monitor soil moisture, temperature, and properties globally for precision agriculture from any AI agent.
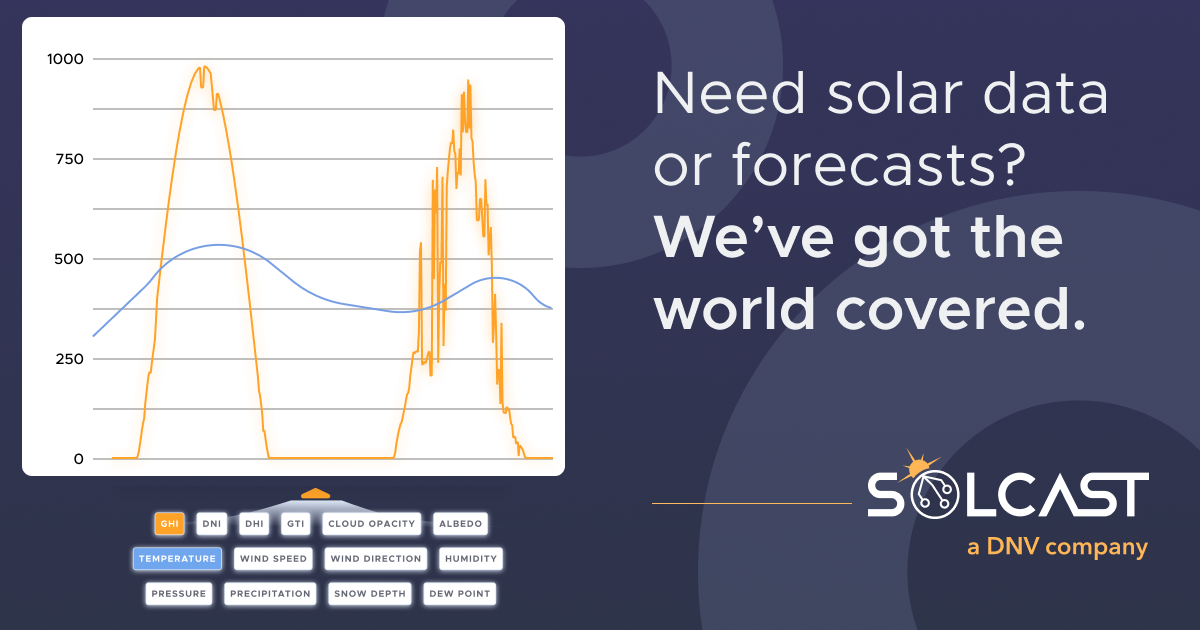
Solcast Solar
11 outilsAccess solar irradiance and PV power forecasts — rooftop solar estimates, radiation data, and weather forecasts via Solcast API.

NOAA Marine — Tides, Currents & Coastal Data
6 outilsUS coastal oceanographic data: real-time water levels (tides), tide predictions, ocean currents, water temperature, coastal meteorological conditions, and multi-decade sea level rise trends from NOAA CO-OPS stations.
Vous pourriez aussi aimer
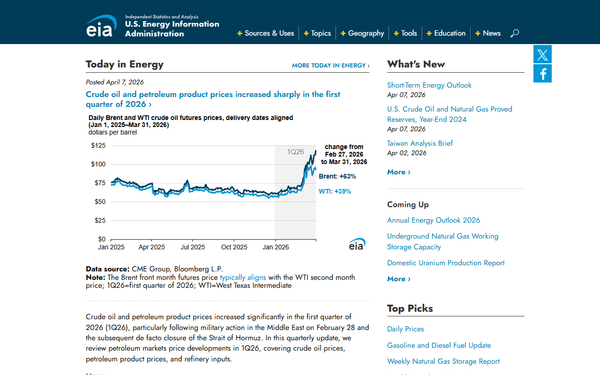
EIA Natural Gas — Gas Market Intelligence
7 outilsNatural gas market data: Henry Hub spot and futures prices, underground storage levels (the weekly report that moves markets), LNG imports/exports, production by state, pipeline flows, and consumption by sector.
World Bank Education & Health
5 outilsRetrieve global life expectancy, infant mortality, literacy rates, and social welfare statistics without any authentication.
data.world
10 outilsEquip your AI agent to discover and manage data assets, projects, and queries directly via the data.world API.