Qase MCP. Query Test Metrics and Defects from Your Chat.
 Gemini
 Works with every AI agent you already use
…and any MCP-compatible client
Just plug in your AI agents and start using Vinkius.
Qase connects test management directly into your AI chat client. List projects, get project overviews, and track defects without opening the Qase dashboard.
Your agent uses tools like `list_projects`, `get_run`, and `list_defects` to provide instant QA status reports.
What your AI agents can do
Get case
Retrieves all details for one specific, identified test case.
Get project
Pulls the full data and metrics for a specified Qase project.
Get run
Retrieves detailed results and analytics for one specific test run instance.
Lists all projects in Qase or retrieves detailed metrics for a single project using list_projects and get_project.
Retrieves, lists, and checks the status of specific test cases (get_case) or entire groups of tests via suites and plans.
Lists all completed or in-progress test runs for a project using list_runs and retrieves detailed results for any single run with get_run.
Finds and lists defects linked to failed tests (list_defects) or tracks key development milestones across the project lifecycle.
Lists all available test cases, suites, and plans within a specific Qase project scope using list_cases, list_suites, and list_plans.
Ask AI about this MCP
Supported MCP Clients
Gemini Waiting for input…
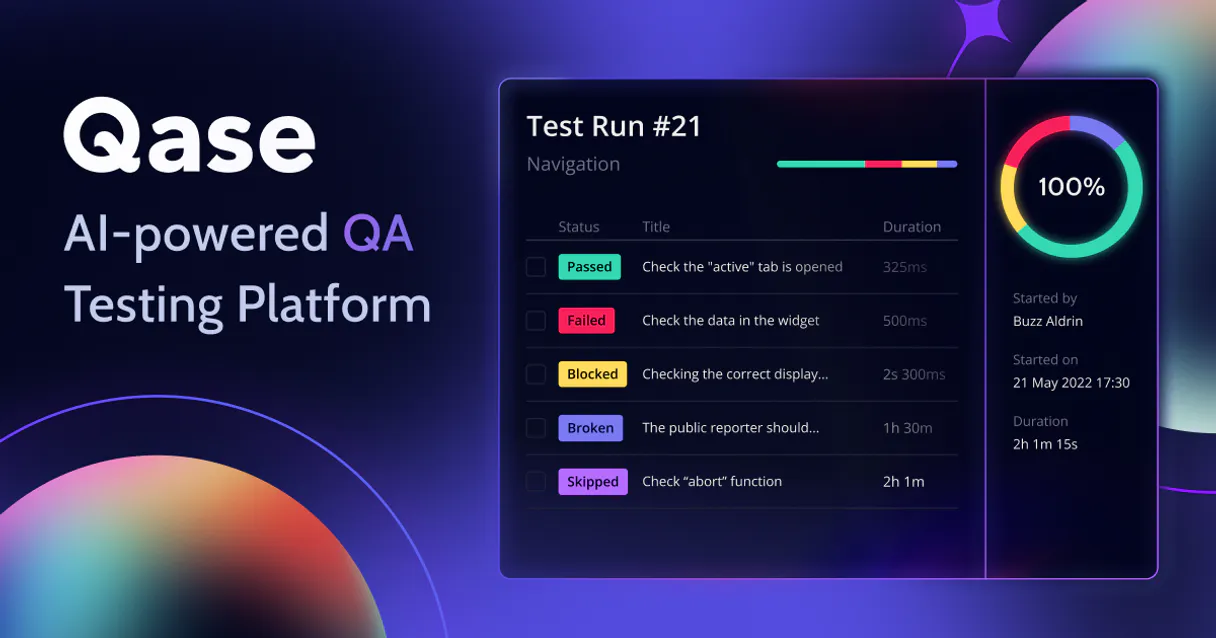
Qase MCP Server: 10 Tools for Test Management
Access all core Qase functionalities—from listing projects to tracking defects—through dedicated tools, allowing your AI client to perform complex QA tasks.
019d75fbget case
Retrieves all details for one specific, identified test case.
019d75fbget project
Pulls the full data and metrics for a specified Qase project.
019d75fbget run
Retrieves detailed results and analytics for one specific test run instance.
019d75fblist cases
Lists all test cases that belong to a defined project or suite.
019d75fblist defects
Gathers and lists every defect logged that is connected to failed test cases in the project.
019d75fblist milestones
Retrieves a list of all defined milestones for a given Qase project.
019d75fblist plans
Lists every test plan setup within an existing project.
019d75fblist projects
Provides a list of all active projects available in your entire Qase account.
019d75fblist runs
Lists every recorded test run history for a specific project.
019d75fblist suites
Retrieves all defined test suites within the current Qase project scope.
Choose How to Get Started
Build a custom MCP for your own tools, or connect a ready-made integration from our catalog.
Build Your Own
Turn any API into an MCP. Import a spec, define Agent Skills, or deploy with MCPFusion.
- Import from OpenAPI, Swagger, or YAML specs
- Create Agent Skills with progressive disclosure
- Deploy to edge with MCPFusion framework
- Built in DLP, auth, and compliance on every call
- Real time usage dashboard and cost metering
- Publish to catalog or keep private
Make Your AI Do More
Start with Qase, then connect any of our 4,700+ other servers whenever your AI needs more. One click, no limits.
- Use this MCP plus 4,700+ others, all in one place
- Add new capabilities to your AI anytime you want
- Every connection is secured and compliant automatically
- Track usage and costs across all your servers
- Works with Claude, ChatGPT, Cursor, and more
- New servers added to the catalog every week
What you can do with this MCP connector
Qase connects your whole testing setup right into your AI client. You don't gotta open the Qase dashboard to pull test data or check metrics. Your agent handles all that heavy lifting, letting you manage complex QA operations just through chat.
Getting a Bird's Eye View of the Project:
To start, your agent can list every active project in your whole Qase account using list_projects. If you know which project you want to dive into, you pull all its core data and key metrics with one call to get_project, giving you a complete status report without clicking anything. You'll never have trouble getting an overview of the entire portfolio.
Navigating Tests and Suites:
You can see exactly what tests exist by listing every test case that belongs to a specific project or suite using list_cases. For a deeper look, your agent pulls all defined test suites within the current project scope via list_suites, and it also lists every single test plan setup available in the project with list_plans.
If you need specifics on one piece of work, you can retrieve all details for any identified test case using get_case.
Tracking Execution Status:
To monitor what's going down, your agent lists every recorded run history for a specific project through list_runs. You then get deep into the weeds by retrieving detailed results and analytics for any single test run instance using get_run, letting you see exactly which tests passed, failed, or got blocked during that cycle.
This gives you full visibility on your current testing efforts.
Finding Bugs and Milestones:
When something breaks, your agent finds it fast. It gathers and lists every defect logged that's tied directly to a failing test case in the project using list_defects. You can also track the development lifecycle by pulling a list of all defined milestones for the project with list_milestones.
How Your Agent Uses These Tools:
- Need to know which projects you're working on? Just ask it to run
list_projects. - Want the full scorecard for Project X? It runs
get_project. - You want a rundown of all available test cases in this suite? Use
list_casesor check the groups withlist_suites. - If you gotta dig into what failed last week, your agent lists all history using
list_runs, and then usesget_runto show the specific failure data. - It'll grab a list of every open bug linked to a failing test case by calling
list_defects. - Your agent also tracks key development steps: it pulls milestones with
list_milestonesand lists all existing plans usinglist_plans.
Bottom Line: Your AI client handles the entire flow. You'll get instant QA status reports, project overviews, and defect tracking without ever having to click a button or leave your chat window.
How Qase MCP Works
- 1 Subscribe to the server and authorize it with your Qase API Token.
- 2 Your AI client sends a prompt (e.g., 'Show defects for the Web Portal').
- 3 The agent identifies the necessary tool (
list_defects), executes it, and returns structured data that is presented in plain language.
The bottom line is you manage QA operations by talking to your AI client instead of clicking through dashboards.
Who Is Qase MCP For?
QA Engineers who are sick of switching context between their IDE and the test dashboard. Developers who need instant reports on failed runs before merging code. Product Managers needing quick metrics on milestone completion to report up.
Needs to quickly pull a specific, detailed test case using get_case while writing automation scripts in their IDE.
Asks the agent to list recent defects or failed runs related to a feature they just deployed so they can fix it immediately.
Requests an instant summary of test run coverage and checks project milestone completion metrics without manual data gathering.
What Changes When You Connect
- Stop opening ten different tabs. Use
list_projectsto get a high-level overview of the entire test portfolio, seeing total case counts and defect totals instantly. - When you find a failing build, use
list_defects. It doesn't just list IDs; it gives severity levels and links right to the issue tickets—no manual searching required. - Need to check if your feature tests are covered? Use
list_suitesto see all defined test groups in a project. Then uselist_casesto confirm every expected scenario is mapped. - When troubleshooting, don't guess which run failed. Call
get_runand get the deep analytics for that specific execution, pinpointing exactly where tests passed or blocked. - Developers can keep their focus on code. They ask their agent to list defects related to 'User Profile' and get structured data using
list_defects, all without leaving their terminal.
Real-World Use Cases
The Scope Check
A Product Manager needs a quick status check on the entire platform. Instead of logging into Qase and clicking through dashboards, they ask: 'What are all active projects?' The agent uses list_projects to immediately give back three project names, their case counts, and open defect totals.
The Post-Deployment Review
A Developer just pushed a change. They ask the agent: 'Did anything break in API V2?' The agent runs list_runs to see recent attempts and then uses get_run on the latest run. It immediately flags any failures and pulls up linked defects using list_defects.
The Test Coverage Audit
A QA Engineer needs to verify if a specific feature has comprehensive testing. They ask for test plans and suites in that area. The agent uses list_plans and then confirms the structure using list_suites, giving them confidence before writing new scripts.
The Deep Dive Investigation
A team member finds a bug report but needs to know its full context. They ask: 'Show me details for defect #12.' The agent uses list_defects to confirm the status and then calls get_case on the associated test case ID, providing all pre-conditions and steps instantly.
The Tradeoffs
Assuming a summary is enough
Asking 'Give me the health of Web Portal' and getting vague text. You don't get actionable data, just filler.
→
Don’t ask for summaries; ask for mechanisms. Use get_project or combine list_runs with a specific date range to force structured output.
Confusing scope
Asking 'List all cases' but not specifying which project you mean, resulting in an error or partial list.
→
Always narrow the scope first. Start with list_projects to confirm the correct ID, then use that Project ID when calling list_cases.
Over-relying on manual checks
Copying defect IDs from one dashboard and pasting them into a spreadsheet manually.
→
Use list_defects. This tool automatically gathers all linked data points—severity, status, and issue link—and presents it in an exportable format.
When It Fits, When It Doesn't
You should use this server if your workflow requires querying specific, structured test metrics (e.g., 'List defects,' 'Get run analytics') rather than just chatting about features. Use it when you need the AI to perform a mechanical data retrieval step. Don't use it if you are simply trying to brainstorm ideas or draft high-level user stories; those require general LLM knowledge, not Qase data. If your task is 'What should we test next?' (brainstorming), stick to pure chat. If your task is 'Did the last build fail on the Mobile App?' (data retrieval), this server and tools like list_runs are exactly what you need.
Independent Platform Disclaimer: Vinkius is an independent platform and is not affiliated with, endorsed by, sponsored by, verified by, or otherwise authorized by Qase. All third-party trademarks, logos, and brand names are the property of their respective owners. Their use on this website is strictly for informational purposes to identify service compatibility and interoperability.
VINKIUS INFRASTRUCTURE
Cloud Hosted
Managed infra
V8 Isolated
Sandboxed per request
Zero-Trust Proxy
No stored credentials
DLP Enforced
Policy on every call
GDPR Compliant
EU data residency
Token Compression
~60% cost reduction
Works with Claude, ChatGPT, Cursor, and more
The Model Context Protocol standardizes how applications expose capabilities to LLMs. Instead of operating in isolation, your AI gains direct access to external platforms, live data, and real-world actions through secure, standardized connections.
This server provides 10 capabilities that interface natively with Claude, ChatGPT, Cursor, and any MCP client. No middleware. No custom integration required.
Available Capabilities
Pulling QA status used to mean opening a dozen tabs.
Today, checking test coverage means bouncing between the project overview, the case library, and the run history. You manually filter by date, click through suites, and cross-reference defect IDs across three different screens just to get a single status report.
Now, your agent pulls that entire picture together. Ask it to check 'Web Portal' coverage. It runs `list_projects` first, then uses `get_project` to pull the key metrics—cases, runs, defects—and hands you one clean summary.
Qase MCP Server: Get structured data with list_defects.
Before this server, finding critical bugs required navigating to the defect module, filtering by status (Open), and then manually reading the severity level for each ticket. It was slow, tedious, and prone to human error.
Now, you just ask about defects. The agent uses `list_defects` to pull all relevant data points—severity, status, link ID—and presents them instantly, making your bug triage process immediate.
Common Questions About Qase MCP
How do I list all available Qase projects using the list_projects tool? +
Call list_projects. This tool retrieves a comprehensive roster of every project in your Qase instance. It gives you the necessary IDs and basic metrics for each one, letting you decide where to dig deeper.
Which tool should I use if I only want details on one test case? +
Use get_case. This function takes a specific Case ID and pulls all the underlying data: pre-conditions, steps, expected results. It's your deep dive into a single piece of testing logic.
Can I check recent test run history with list_runs? +
Yes, list_runs pulls the full history for a given project. You can see when runs started and what their final status was (Passed/Failed), giving you a timeline view of stability.
What is the difference between list_cases and list_suites? +
Use list_cases to get all individual test definitions. Use list_suites when you want to see groups or collections of related tests that have been bundled together for execution.
I need defect reports, should I use list_defects or list_runs? +
Use list_defects. While list_runs tells you if a failure happened, list_defects gives you the actual bug report: severity, description, and issue link. It's the source of truth for bugs.
How do I set up my connection after authorizing the Qase API Token for list_projects? +
You must pass a valid and active Qase API token with every request. The server uses this token to authenticate all calls, including list_projects. Always treat your credentials like a password.
When using list_cases or list_suites, can I filter results by specific status codes? +
Yes, you must pass specific parameters to narrow the scope of these lists. You typically filter by project ID and case statuses (like 'Passed' or 'Failed') when calling list_cases.
If I call list_runs frequently, is there a limit on how many requests I can make in a short time? +
Yes, rapid calls can trigger rate limiting. We recommend pacing your requests and utilizing the pagination parameters to fetch large datasets instead of making single bulk calls.
How do I securely obtain my Qase Token? +
Log in to Qase.io and click your profile icon to go to Account settings. Select API Tokens (or sometimes found under Apps for an integration token), and click Create a new API token. Add a name, click generate, and copy the string provided. It takes exactly 15 seconds. Paste it here to authenticate. Your token is encrypted at rest and injected securely at runtime.
Can my AI write test scripts using the case details? +
Absolutely. Inside your IDE (like Cursor), you can ask the agent to 'Fetch case #12 from Qase project PROJ'. The tool retrieves the precise steps, preconditions, and expected results. The agent can then automatically generate Playwright, Cypress, or Selenium scripts based exactly on those Qase definitions.
How can I check the results of a recent QA cycle? +
Ask your agent to list_runs for your project. This will surface your recent executions. If you notice a run with a high failure rate, ask the agent to pull get_run with that run's ID to dive into specifics and see which modules failed the automated checks.
Can it help me track Jira bugs linked to tests? +
Yes. By using the list_defects capability, your AI can pull all registered defects in a Qase project. If your Qase is integrated with Jira or GitHub, the returned defect data includes external issue links, helping developers immediately map a failed test to the corresponding engineering ticket.
Use it with your favorite AI tools
Connect this server to Cursor, Claude, VS Code, and more.
More in this category

OpenAPI Validator Engine
Validate any OpenAPI or Swagger spec (2.0, 3.0, 3.1, 3.2) local before generating code from it. Returns version, validity, and every schema error with exact paths. Your spec quality gate.
CoderPad
Manage technical interviews and assessments via CoderPad — create pads, track interview events, and audit the question bank directly from any AI agent.
BlazeMeter
Automate continuous performance testing via BlazeMeter — manage workspaces, trigger load tests, and analyze active run metrics securely via AI.
You might also like

Aliyun API Market / 阿里云云市场
China's largest API marketplace — access thousands of 3rd-party OCR, SMS, and data services via AI.
CrewAI Platform
Orchestrate multi-agent workflows via CrewAI — list crews and agents, kickoff autonomous runs, and monitor task execution directly from any AI agent.

IBM watsonx
Connect IBM watsonx to any AI agent via MCP.