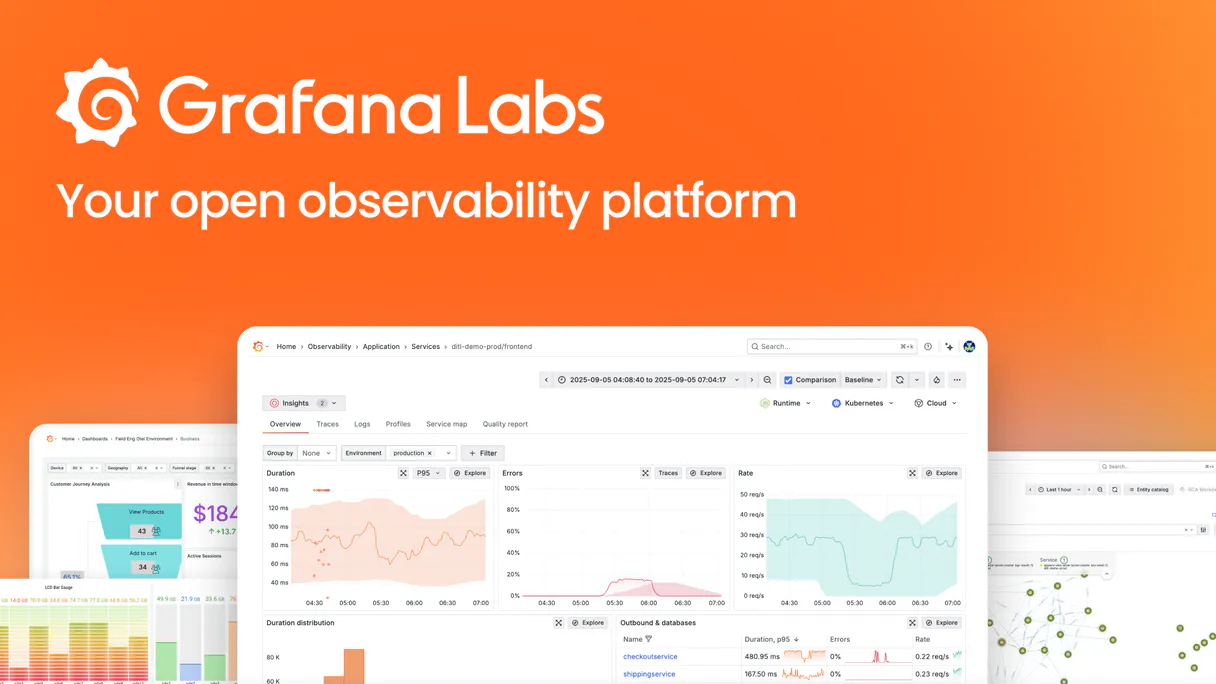
Grafana MCP, Ready to Go
Use the Grafana MCP with Claude or Cursor to manage observability, check firing alerts, and inspect dashboard queries using your AI agent.
No credit card required. Experience the power of this integration risk-free.
Manage your observability and monitoring dashboards through natural language.
Works with every AI agent you already use
…and any MCP-compatible client
How fast is the Grafana Connector?
Average time for the server to become ready for requests over the last 14 days, measured until the initialize / tools/list handshake completes. Metrics are updated daily between 00:00 and 04:00 UTC. Create a free account, use this Connector on Vinkius Cloud, and connect it to your AI agent in seconds.
Waiting for input…
What AI agents can do with Grafana MCP 4 Tools for Observability
Use these tools to search dashboards, pull queries, list data sources, and check active alerts through your AI agent.
Search dashboards
Find specific dashboards using titles or tags. It returns the unique IDs you need for deeper inspection.
Get dashboard
Pull the full configuration of a dashboard using its UID. This lets you see every panel and query in the set.
List datasources
See every data source connected to your Grafana instance. It's the fastest way to verify your connectivity boundaries.
Firing alerts
Get a list of alerts that are currently in a firing state. You can see labels and annotations for active incidents.
A Connector is a URL. Vinkius runs it: hosting, security, governance, observability.
You're looking at one of 5,800+ managed Connectors. The real value isn't the catalog. It's the control plane that secures, governs, audits, and manages every interaction between your agents and the tools they use.
No Shadow AI
Every agent action is visible, approved, and auditable. Nothing runs outside your governance.
Absolute agent control
Fine-grained permissions for every agent, MCP, and tool. Instantly revoke access and audit every execution.
Cost control per token
Spend broken down to the token, tool, and agent. Budgets and hard limits. No surprise invoices.
Managed & monitored infra
We operate the runtime, authentication, scaling, retries, and monitoring. Your team manages AI, not infrastructure.
Data protection, DLP by design
Sensitive data is filtered before reaching the model. Access is governed so agents receive only the information they're allowed to use.
Token optimization, real savings
Lower AI costs by delivering the right context instead of unnecessary tools. Better accuracy, faster responses, and fewer wasted tokens.
Grafana MCP for Observability and Incident Response
This is for the SREs and DevOps engineers who are tired of clicking through dozens of tabs during a high-pressure incident. It's for anyone who needs to move from manual dashboard navigation to instant, query-based answers.
SRE Engineer
Checks firing alerts and pulls PromQL queries during active incidents to identify root causes faster.
DevOps Engineer
Audits data source connections and searches for specific dashboards to verify deployment health.
Cloud Architect
Verifies data source configurations and dashboard organization across different environments.
Software Developer
Extracts specific queries from production panels to verify metrics during the development cycle.
Frequently Asked Questions
Can the Grafana MCP help me during a production outage? +
Yes, it lets your agent check firing alerts instantly so you can see what's broken without hunting through the UI.
Can I use the Grafana MCP to see my PromQL queries? +
Yes, it can pull the full configuration of any dashboard, including all the underlying queries for every panel.
Does the Grafana MCP support Loki or SQL databases? +
Yes, it can list all configured data sources, which includes Loki, SQL, and Prometheus.
How does the Grafana MCP find specific dashboards? +
You can ask your agent to search by title or tag, and it will find the right one for you automatically.
Can I use this to audit my monitoring setup? +
Yes, it's great for listing all data sources and checking alert rules to ensure everything is configured correctly.
Is the Grafana MCP good for developers? +
It's excellent for devs who need to quickly grab metrics or log queries from existing production dashboards.
Can my agent search for specific dashboards in my Grafana instance? +
Yes. Use the 'search_dashboards' tool. You can provide an optional query string to match titles or tags. The agent will return basic info including the unique UID required for deeper inspection.
How do I extract the PromQL or SQL queries from a dashboard panel via chat? +
Use the 'get_dashboard' tool with the dashboard UID. Your agent will retrieve the full JSON configuration, including all panels and their underlying data queries, enabling you to review the exact metrics logic natively.
Can I see firing alerts through the agent? +
Absolutely. Use the 'list_alerts' tool. The agent retrieves all configured alert rules and their current statuses, allowing you to identify which monitors are currently in a firing state synchronousy.
Your AI, connected to everything.


No credit card required · Free tier available


Other Connectors in this category
Miro Connector
Manage Miro boards, items and comments via API. Create boards, add sticky notes, browse items and manage members from any AI agent.
Checkly Connector
Manage application monitoring and E2E testing via Checkly. Track API uptime, trigger checks, and monitor performance directly from any AI agent.
Dotenv Parser Engine Connector
Parse .env file content into structured JSON. Handles quotes, multiline values, and comments deterministically.
Related Connectors
DocsBot Connector
Equip your AI agent to manage AI-powered knowledge bases, track sources, and query your bots via the DocsBot API.
Expedia Hotels Connector
Automate hotel research via Expedia. Search global property availability, compare room rates, and analyze guest reviews directly from any AI agent.
QuickNode Connector
Manage blockchain infrastructure via QuickNode. Create data streams, configure webhooks, and interact with RPC nodes directly from your AI agent.
Powerful workflows with this Connector
MCP Recipe for Full-Stack Observability
Two monitoring tools, zero correlation , your Datadog alerts say 'high latency' and your Grafana dashboards say 'database connections maxed' but nobody connected the dots until the postmortem
Connectors for Global Edge Performance
Cache hit ratios monitored, edge latency tracked, WAF threats counted, performance reports delivered , run your edge infrastructure from one prompt