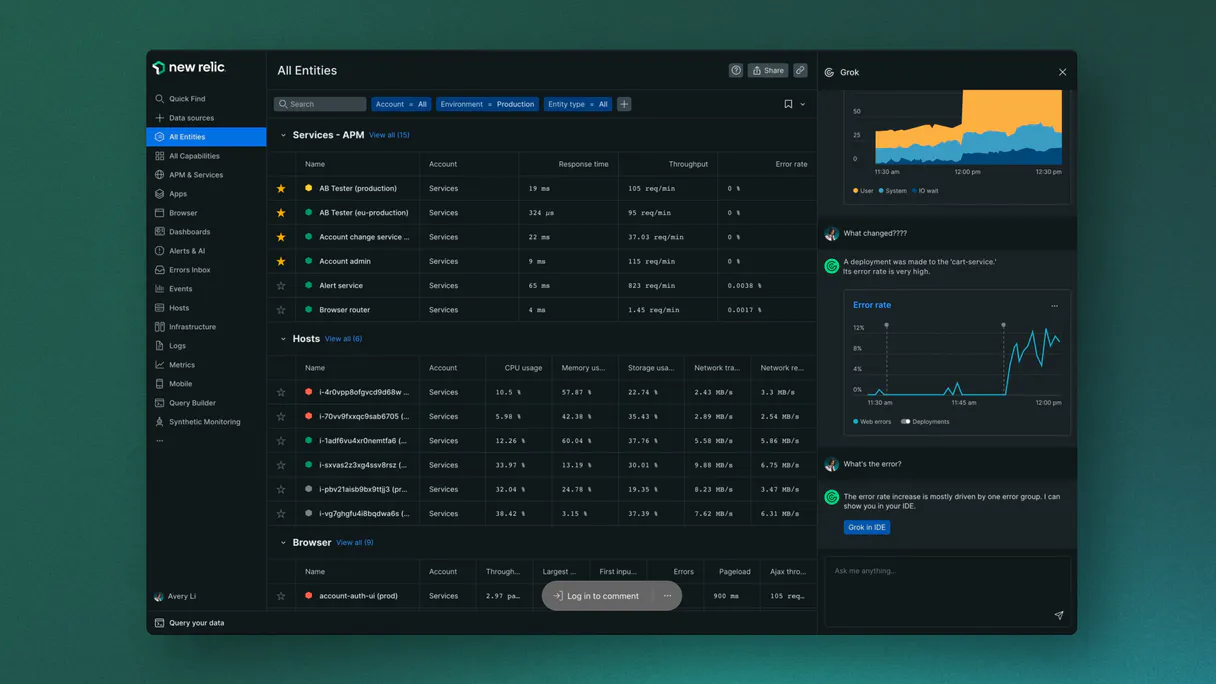
New Relic AI (LLM Observability) MCP. Track costs, performance, and errors via conversation.
 Gemini
 Works with every AI agent you already use
…and any MCP-compatible client
Just plug in your AI agents and start using Vinkius.
New Relic AI (LLM Observability) tracks everything about your LLMs—costs, performance, and quality—using natural language queries. You check token spending with `query_llm_costs`, find slow responses using `query_llm_latency`, and audit user feedback via `query_llm_feedback`.
It lets you turn complex observability data into simple conversation prompts.
What your AI agents can do
Custom nrql
Run complex, read-only queries using New Relic Query Language (NRQL) for deep insights.
List alert policies
Checks all defined alert policies to audit what triggers alerts in your system.
List apm apps
Lists active APM applications, allowing you to check the structural health of your AI environment.
Runs structural queries to determine the exact USD cost of all tokens consumed by your LLM infrastructure.
Provides p95 latency metrics and average response times for LLM text generation, ensuring performance targets are met.
Retrieves a record of all LLM chat completions, prompts, and events to understand the model's behavior in real-time.
Gathers human supervisor feedback and 1-5 star ratings attached to AI interactions for quality review.
Executes custom, read-only New Relic Query Language (NRQL) statements against your entire monitoring dataset.
Ask AI about this MCP
Supported MCP Clients
Gemini Waiting for input…
New Relic AI (LLM Observability): 10 Tools
Manage token costs, latency metrics, and error tracking for all your LLM agent operations using these ten specialized tools.
019d75dccustom nrql
Run complex, read-only queries using New Relic Query Language (NRQL) for deep insights.
019d75dclist alert policies
Checks all defined alert policies to audit what triggers alerts in your system.
019d75dclist apm apps
Lists active APM applications, allowing you to check the structural health of your AI environment.
019d75dclist dashboards
Identifies all available dashboards so you can audit which metrics are being tracked.
019d75dcpost custom event
Sends generic telemetry rows to track internal agent states and custom behavioral markers.
019d75dcquery llm costs
Extracts specific data points needed to calculate the exact USD token cost of your LLM operations.
019d75dcquery llm errors
Identifies records related to errors generated during LLM processing runs.
019d75dcquery llm events
Retrieves a record of all structured events and actions that occurred within the New Relic platform for your LLMs.
019d75dcquery llm feedback
Gets user feedback messages and 1-5 rating scores provided by human reviewers.
019d75dcquery llm latency
Provides performance metrics, specifically the p95 latency and average response time for LLM calls.
Choose How to Get Started
Build a custom MCP for your own tools, or connect a ready-made integration from our catalog.
Build Your Own
Turn any API into an MCP. Import a spec, define Agent Skills, or deploy with MCPFusion.
- Import from OpenAPI, Swagger, or YAML specs
- Create Agent Skills with progressive disclosure
- Deploy to edge with MCPFusion framework
- Built in DLP, auth, and compliance on every call
- Real time usage dashboard and cost metering
- Publish to catalog or keep private
Make Your AI Do More
Start with New Relic AI (LLM Observability), then connect any of our 4,700+ other servers whenever your AI needs more. One click, no limits.
- Use this MCP plus 4,700+ others, all in one place
- Add new capabilities to your AI anytime you want
- Every connection is secured and compliant automatically
- Track usage and costs across all your servers
- Works with Claude, ChatGPT, Cursor, and more
- New servers added to the catalog every week
What you can do with this MCP connector
This server tracks everything your LLMs do. It lets you check costs, performance hiccups, and quality control—all using simple natural language questions directed at New Relic’s data set. You'll stop guessing what the model is doing; you'll see it.
To measure how fast things run, use query_llm_latency. This tool gives you the p95 latency and the average response time for every LLM call, so you know immediately if your generation speed hits those performance targets. If you need to check why a call was slow or what went wrong during processing, query_llm_errors pulls up all records related to errors generated by the model.
For a full picture of the conversation, query_llm_events retrieves a complete record of structured actions and every event that happened within the New Relic platform for your LLMs.
When it comes to money, you don't want surprises on the bill. Run query_llm_costs to extract precise data points needed to calculate the exact USD token cost across all your LLM operations. It gives you a clear count of spending so you can budget right. You also gotta keep track of what people think; use query_llm_feedback to grab user feedback messages and the 1-5 star ratings provided by human reviewers, letting you spot quality drops fast.
Need deeper visibility? For complex analysis that doesn't fit standard metrics, run advanced, read-only queries using New Relic Query Language (NRQL) with custom_nrql. This lets you pull deep insights from your entire monitoring dataset. You can also track internal processes and custom behavioral markers by sending generic telemetry rows using post_custom_event.
To audit the structural health of your whole AI setup, check out system tools. Run list_apm_apps to see all active APM applications. You can identify what metrics are being tracked across your platform by calling list_dashboards. If you need to know what rules could trip up your service, use list_alert_policies to audit every defined alert policy in the system.
This toolset lets you go beyond just seeing a graph; you can turn complex observability data into direct conversation prompts about cost, speed, and quality.
How New Relic AI (LLM Observability) MCP Works
- 1 Subscribe to the server and input your New Relic API Key and Account ID.
- 2 Connect your preferred client (Claude, Cursor, etc.) to the MCP endpoint.
- 3 Ask your agent a question, like 'What was the cost of LLM events today?' The agent runs the necessary tool (
query_llm_costs) and gives you the answer.
The bottom line is: You use natural language conversation to run complex monitoring queries that usually require logging into multiple separate dashboards.
Who Is New Relic AI (LLM Observability) MCP For?
ML Engineers, SREs, and Observability Leads. If you're the person who gets paged at 2 AM because an LLM service is slow or expensive, this is for you. You need to diagnose issues—not just see a graph.
Uses query_llm_events and custom_nrql to debug specific model failure modes or verify prompt accuracy.
Checks system health using list_apm_apps and verifies alert policies with list_alert_policies across multiple AI environments.
Runs query_llm_costs and analyzes latency benchmarks from query_llm_latency to manage cloud spend.
What Changes When You Connect
- Stop guessing about spending. Use
query_llm_coststo get the precise USD token consumption for your LLM calls, tying every output back to a real cost center. - Catch slow responses before users complain. Run
query_llm_latencyto pull p95 latency matrices and average response times directly into your chat interface. - Audit model behavior instantly. Instead of clicking through logs, ask for LLM events using
query_llm_eventsto see the literal prompts and completions that happened. - Keep quality high with
query_llm_feedback. Automatically gather 1-5 star ratings from human reviewers whenever an interaction finishes, making regressions immediately visible. - System check in one go. Use
list_apm_appsandlist_dashboardsto audit the entire structural health of your monitoring setup without navigating multiple menus.
Real-World Use Cases
Diagnosing a Sudden Cost Spike
The FinOps team notices billing jumped 30%. Instead of checking general usage dashboards, they run 'What was the cost of LLM events today?' The agent executes query_llm_costs and pinpoints that all consumption came from one specific model version, identifying the spending source immediately.
Fixing Lagging Responses
A user reports that responses feel sluggish. The ML Engineer asks the agent to check performance metrics. The system runs query_llm_latency, revealing that p95 latency spiked last night, pointing directly to a resource constraint issue.
Reviewing Bad Output Quality
After deployment, user satisfaction dips. The Product Manager asks the agent for recent feedback. query_llm_feedback returns 1-5 star scores and comments, showing that a specific type of prompt is consistently receiving low ratings.
Auditing System Structure
A new engineer joins the team and needs to know what monitoring setup exists. They ask the agent to list all dashboards and APM apps. The system runs list_dashboards and list_apm_apps, giving them a full map of the observability stack.
The Tradeoffs
Checking only general metrics
Looking at generic resource utilization graphs to figure out if an LLM service is slow. This gives system load, but not specific model performance or cost.
→
To check model performance and cost, you must use dedicated tools. Run query_llm_latency for speed metrics, and run query_llm_costs to isolate token spending.
Manually querying logs
Having to jump into the raw log viewer and manually filter through thousands of lines of text to find a specific user's prompt or an error code.
→
Use query_llm_events to pull structured data on all LLM actions. If you suspect failure, run query_llm_errors for targeted results.
Over-relying on high-level dashboards
Assuming a dashboard shows everything. Dashboards are summaries; they don't give the raw data points needed to prove root cause or calculate precise cost.
→
For granular, actionable proof, use custom_nrql to write specific queries against the raw dataset or use query_llm_costs for accurate billing numbers.
When It Fits, When It Doesn't
Use this server if your primary need is deep investigation into LLM operational metrics—specifically cost accountability, performance degradation, and user quality feedback. You're not just checking 'is it up?' you're asking 'why did the cost spike on Tuesday afternoon?'
Don't use this if all you need is a simple status check (e.g., 'Is the service running?'). For that, existing dashboards are fine. Use this when you need to cross-reference multiple data points: e.g., linking high latency from query_llm_latency with specific error patterns found via query_llm_errors. If your question requires combining billing metrics (query_llm_costs) with structural information (list_apm_apps), this is the right toolset.
Independent Platform Disclaimer: Vinkius is an independent platform and is not affiliated with, endorsed by, sponsored by, verified by, or otherwise authorized by New Relic AI. All third-party trademarks, logos, and brand names are the property of their respective owners. Their use on this website is strictly for informational purposes to identify service compatibility and interoperability.
VINKIUS INFRASTRUCTURE
Cloud Hosted
Managed infra
V8 Isolated
Sandboxed per request
Zero-Trust Proxy
No stored credentials
DLP Enforced
Policy on every call
GDPR Compliant
EU data residency
Token Compression
~60% cost reduction
Works with Claude, ChatGPT, Cursor, and more
The Model Context Protocol standardizes how applications expose capabilities to LLMs. Instead of operating in isolation, your AI gains direct access to external platforms, live data, and real-world actions through secure, standardized connections.
This server provides 10 capabilities that interface natively with Claude, ChatGPT, Cursor, and any MCP client. No middleware. No custom integration required.
Available Capabilities
Debugging AI costs shouldn't require three different dashboards and a spreadsheet.
Today, tracking LLM spending means jumping through hoops: you check one dashboard for overall usage, another for cost estimates, and a third just to see the basic event stream. You end up cross-referencing data points in Excel—a process that takes time and guarantees human error.
With this MCP server, you talk to your agent instead of clicking through tabs. You ask: 'What did we spend on GPT-4o yesterday?' The agent runs `query_llm_costs`, gives you the number immediately, and cites which model caused it. It's instant diagnosis.
New Relic AI (LLM Observability) MCP Server: Get cost, latency, and history.
Before this, if you found a performance issue, figuring out the root cause meant checking logs for errors (`query_llm_errors`) and then running separate queries to check how many times that error occurred (`custom_nrql`). It was a disjointed workflow.
Now, you combine those steps. You ask: 'Show me all events where latency was high AND an error was logged.' The agent runs the necessary tools and gives one consolidated answer. This links diagnosis directly to action.
Common Questions About New Relic AI (LLM Observability) MCP
How do I find out how much money my LLM is costing using query_llm_costs? +
Run query_llm_costs and specify the date range. The tool extracts detailed metrics showing total USD consumption, broken down by specific models or vendors.
What does query_llm_latency tell me about my AI service? +
query_llm_latency gives you performance benchmarks like p95 latency and average response times. This confirms if your LLM generation remains fast enough for users.
Which tool do I use to see a record of every single chat interaction? +
Use query_llm_events. It pulls structured data on all LLM actions, including the prompt inputs and final completions. This is your full conversation history audit.
Can I check for structural health using list_apm_apps? +
Yes, list_apm_apps validates your environment's structure by listing active Application Performance Monitoring apps. It confirms the basic components are deployed and running correctly.
If I suspect an issue, how do I use `query_llm_errors` to track specific failures? +
It identifies precise active arrays spanning native Hold parsing. This tool helps you pinpoint exactly when and why your LLM agent failed. You can check the volume of errors over time or isolate them by model type.
What is the role of `post_custom_event` in monitoring my AI workflow? +
It inserts absolute generic CustomAITelemetry rows. Use this tool to track internal agent steps that don't generate standard LLM logs, like a successful file write or a decision point in your code.
How do I use `list_alert_policies` to audit my system's warning thresholds? +
It inspects deep internal arrays mitigating specific Plan Math. Running this tool lets you see all existing alert policies and their associated triggers, helping you verify if your LLM usage hits any hard limits.
Can `query_llm_feedback` help me monitor the quality of my agent's responses? +
Yes, it retrieves explicit Cloud logging tracing explicit Vault limits. This function pulls in human supervisor ratings and feedback messages, giving you a direct view of user satisfaction trends.
Can I check my total AI token costs through my agent? +
Yes. Use the query_llm_costs tool. Your agent will execute a NRQL aggregation summing the tokenSpanCost property from your LLM events over the last 24 hours, faceted by model, to provide a clear financial breakdown.
How do I monitor the p95 latency of my LLM generations? +
The query_llm_latency tool retrieves the average duration and latency matrices for your AI providers. Your agent will report the results as a timesheet or summary, helping you identify performance bottlenecks instantly.
Can my agent run custom NRQL queries against my telemetry data? +
Absolutely. Use the custom_nrql tool to provide any valid read-only NRQL string. Your agent will query New Relic's NerdGraph API and return the resulting dataset, allowing for complete flexibility in how you analyze your AI operations.
Use it with your favorite AI tools
Connect this server to Cursor, Claude, VS Code, and more.
More in this category
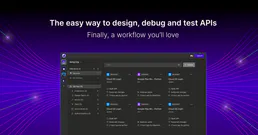
Insomnia (Collaborative API Design)
Manage API designs and collections via Insomnia — list organizations, projects, and files, and audit API specs.

Node-RED
Manage Node-RED flows, nodes, and system diagnostics directly from your AI agent.

Figma
Connect Figma to automate design workflows — inspect files, render layers as images, and manage comments directly from your AI agent.
You might also like

Cerbos
Decouple authorization logic from your application. Evaluate permissions, generate query plans, and manage access control via AI.

Lorem Ipsum Generator
Generate deterministic placeholder text by words, sentences, or paragraphs. When an AI writes filler text, it varies wildly every time — this engine delivers consistent, predictable lorem ipsum.

Normality Test Engine
Test whether your data is normally distributed using Skewness and Kurtosis analysis local. Essential pre-check before running parametric statistical tests.