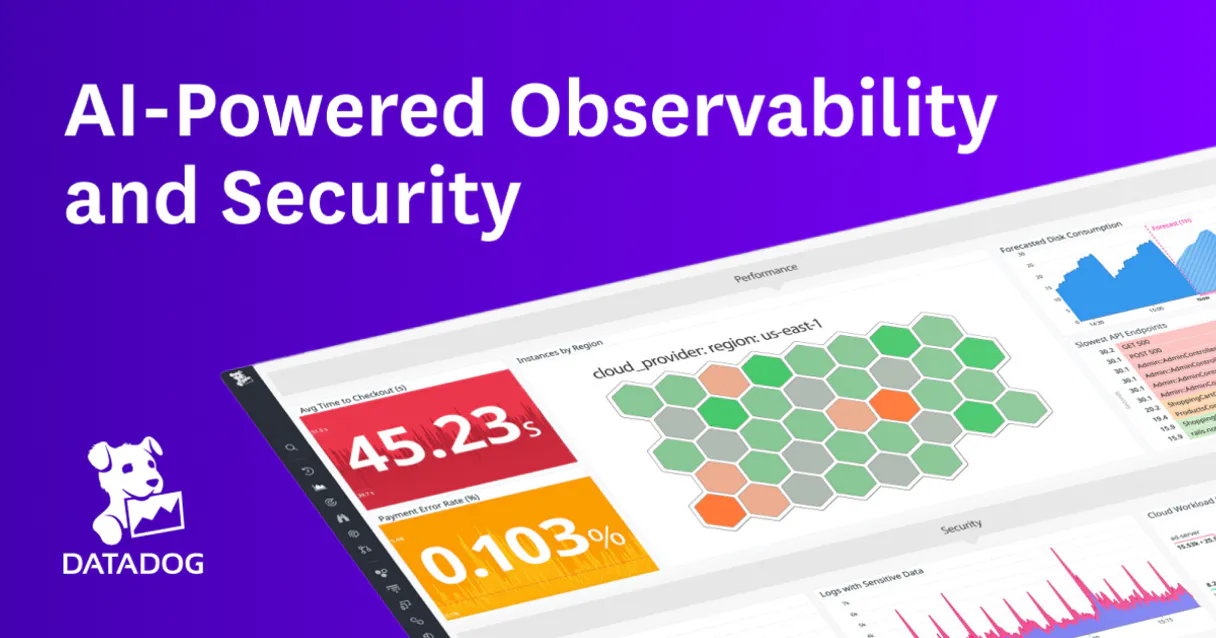
Bring Full Stack Monitoring
to LangChain
Learn how to connect Datadog to LangChain and start using 16 AI agent tools in minutes. Fully managed, enterprise secure, and ready to use without writing a single line of code.
What is the Datadog MCP Server?
Connect your Datadog account to any AI agent and take full control of your observability stack through natural conversation.
What you can do
- Monitor Management — List, search, inspect, and mute monitors to control alert noise during maintenance windows
- Dashboard Inspection — Browse dashboards and retrieve full layouts, widgets, and template variables
- Metric Queries — Run time-series queries using Datadog syntax (e.g.,
avg:system.cpu.user{*}) with custom time ranges - Log Search — Search log events using Datadog query syntax across all indexed log sources
- Event Tracking — Browse platform events and create custom events with tags and priority levels
- Incident Management — List active incidents with severity, status, responders, and timeline details
- SLO Monitoring — Review Service Level Objectives with targets, error budgets, and compliance status
- Host Inventory — Access all reporting hosts with metadata, tags, and agent versions
How it works
1. Subscribe to this server
2. Enter your Datadog API Key and your site URL (e.g., https://api.datadoghq.com for US or https://api.datadoghq.eu for EU)
3. Start monitoring your infrastructure from Claude, Cursor, or any MCP-compatible client
Who is this for?
- SRE / DevOps Engineers — query monitors, mute noisy alerts, and inspect incidents without opening the Datadog dashboard
- Platform Teams — run metric queries and validate SLO compliance through conversational AI
- On-Call Engineers — triage incidents, search error logs, and check host health during outages via natural language
Built-in capabilities (16)
Verify connectivity
Create an event
Get dashboard details
Get incident details
Get monitor details
List dashboards
List events
List hosts
List incidents
List metrics
List monitors
List SLOs
Mute a monitor
Query metric data
Search logs
Search monitors
Why LangChain?
LangChain's ecosystem of 500+ components combines seamlessly with Datadog through native MCP adapters. Connect 16 tools via Vinkius and use ReAct agents, Plan-and-Execute strategies, or custom agent architectures. with LangSmith tracing giving full visibility into every tool call, latency, and token cost.
- —
The largest ecosystem of integrations, chains, and agents. combine Datadog MCP tools with 500+ LangChain components
- —
Agent architecture supports ReAct, Plan-and-Execute, and custom strategies with full MCP tool access at every step
- —
LangSmith tracing gives you complete visibility into tool calls, latencies, and token usage for production debugging
- —
Memory and conversation persistence let agents maintain context across Datadog queries for multi-turn workflows
Datadog in LangChain
Datadog and 3,400+ other MCP servers. One platform. One governance layer.
Teams that connect Datadog to LangChain through Vinkius don't need to source, host, or maintain individual MCP servers. Every tool call runs inside a hardened runtime with credential isolation, DLP, and a signed audit chain.
Raw MCP | Vinkius | |
|---|---|---|
| Server catalog | Find and host yourself | 3,400+ managed |
| Infrastructure | Self-hosted | Sandboxed V8 isolates |
| Credential handling | Plaintext in config | Vault + runtime injection |
| Data loss prevention | None | Configurable DLP policies |
| Kill switch | None | Global instant shutdown |
| Financial circuit breakers | None | Per-server limits + alerts |
| Audit trail | None | Ed25519 signed logs |
| SIEM log streaming | None | Splunk, Datadog, Webhook |
| Honeytokens | None | Canary alerts on leak |
| Custom domains | Not applicable | DNS challenge verified |
| GDPR compliance | Manual effort | Automated purge + export |
Why teams choose Vinkius for Datadog in LangChain
The Datadog MCP Server runs on Vinkius-managed infrastructure inside AWS — a purpose-built runtime with per-request V8 isolates, Ed25519 signed audit chains, and sub-40ms cold starts. All 16 tools execute in hardened sandboxes optimized for native MCP execution.
Your AI agents in LangChain only access the data you authorize, with DLP that blocks sensitive information from ever reaching the model, kill switch for instant shutdown, and up to 60% token savings. Enterprise-grade infrastructure, zero maintenance.
* Every MCP server runs on Vinkius-managed infrastructure inside AWS - a purpose-built runtime with per-request V8 isolates, Ed25519 signed audit chains, and sub-40ms cold starts optimized for native MCP execution. See our infrastructure
How Vinkius secures
Datadog for LangChain
Every tool call from LangChain to the Datadog MCP Server is protected by DLP redaction, cryptographic audit chains, V8 sandbox isolation, kill switch, and financial circuit breakers.
Frequently asked questions
Can I silence noisy monitors during scheduled maintenance?
Yes. The mute_monitor action silences a specific monitor by its ID, suppressing all alert notifications. This is ideal during deployment windows or planned maintenance. Use search_monitors to find the monitor by name or tag first, then mute it by ID.
Does Datadog require two credentials to connect?
Yes. You need your API Key (found in Organization Settings > API Keys) and your Base URL, which depends on your Datadog site region: https://api.datadoghq.com for US1, https://api.datadoghq.eu for EU, or https://api.us3.datadoghq.com for US3. The API Key is sent via the DD-API-KEY header.
Can I run time-series metric queries with custom time ranges?
Yes. The query_metrics tool accepts a Datadog metric query string (e.g., avg:system.cpu.user{host:web-01}), a start epoch timestamp, and an end epoch timestamp. It returns the time-series data points for that metric across the specified window.
How does LangChain connect to MCP servers?
Use langchain-mcp-adapters to create an MCP client. LangChain discovers all tools and wraps them as native LangChain tools compatible with any agent type.
Which LangChain agent types work with MCP?
All agent types including ReAct, OpenAI Functions, and custom agents work with MCP tools. The tools appear as standard LangChain tools after the adapter wraps them.
Can I trace MCP tool calls in LangSmith?
Yes. All MCP tool invocations appear as traced steps in LangSmith, showing input parameters, response payloads, latency, and token usage.
MultiServerMCPClient not found
Install: pip install langchain-mcp-adapters