Datadog MCP. Query metrics, logs, and incidents via chat.
 Gemini
 Works with every AI agent you already use
…and any MCP-compatible client
Just plug in your AI agents and start using Vinkius.
Datadog provides unified observability for your entire tech stack. Use this MCP to run deep metric queries, search error logs across all sources, inspect active incidents, and validate Service Level Objectives (SLOs) without opening a dashboard.
It gives you full-stack visibility, right from your chat client.
What your AI agents can do
Check datadog status
Verifies basic connectivity to the Datadog API.
Create event
Allows you to manually generate a custom event record in the platform.
Get dashboard
Retrieves detailed layout information for a specific dashboard ID.
List Service Level Objectives (SLOs) to check current error budgets and compliance status.
Run time-series queries using Datadog syntax to analyze specific system metrics over custom ranges.
List and get details on current incidents, showing severity, responders, and the full timeline.
Search log events using Datadog query syntax across all indexed log sources to find root causes.
List, search, and mute individual monitors when the system generates too many false alarms.
Ask AI about this MCP
Supported MCP Clients
OAuth 2.0 Compatible Gemini Waiting for input…
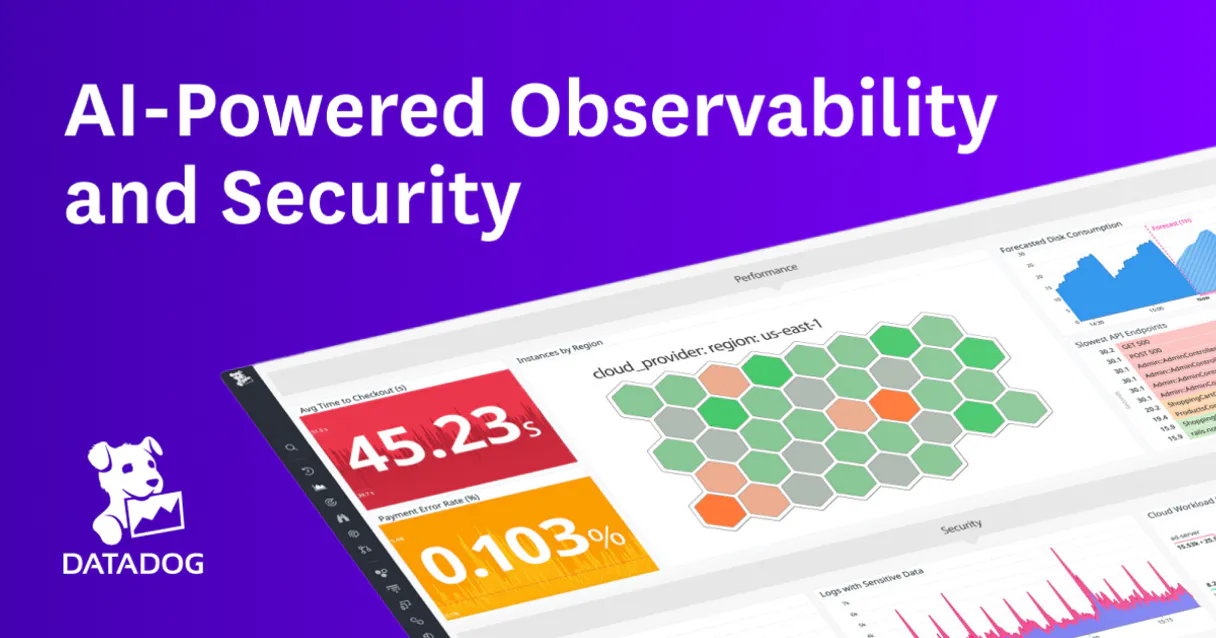
Datadog: 16 Tools for Observability
These tools let you programmatically manage everything from listing service SLOs to running complex log searches, giving total control over monitoring data.
Make your AI actually useful.
Add this MCP to Claude, Cursor, or Windsurf and your AI stops guessing. It gets real tools to look things up, take action, and handle the stuff you keep doing by hand.
Start using Datadog on Vinkius019dd0dccheck datadog status
Verifies basic connectivity to the Datadog API.
019dd0dccreate event
Allows you to manually generate a custom event record in the platform.
019dd0dcget dashboard
Retrieves detailed layout information for a specific dashboard ID.
019dd0dcget incident
Fetches full details about a single, active incident.
019dd0dcget monitor
Retrieves the configuration and current status of an individual monitor.
019dd0dclist dashboards
Lists all available dashboards in your account for quick reference.
019dd0dclist events
Retrieves a list of recent platform events, including tags and priority levels.
019dd0dclist hosts
Lists all reporting hosts along with their metadata and agent versions.
019dd0dclist incidents
Gets a summary list of active service incidents, showing severity and status.
019dd0dclist metrics
Returns a comprehensive list of all available metrics in the system.
019dd0dclist monitors
Provides an overview of every configured monitor, helping you see what's alerting.
019dd0dclist slos
Lists all defined Service Level Objectives (SLOs) and their compliance status.
019dd0dcmute monitor
Temporarily silences an alert monitor to prevent notification spam during testing or maintenance.
019dd0dcquery metrics
Executes detailed time-series queries using Datadog syntax for specific metric data points.
019dd0dcsearch logs
Searches through historical log events across all indexed sources based on query criteria.
019dd0dcsearch monitors
Finds monitors matching specific keywords or configuration filters.
Choose How to Get Started
Build a custom MCP for your own tools, or connect a ready-made integration from our catalog.
Build Your Own
Turn any API into an MCP. Import a spec, define Agent Skills, or deploy with MCPFusion.
- Import from OpenAPI, Swagger, or YAML specs
- Create Agent Skills with progressive disclosure
- Deploy to edge with MCPFusion framework
- Built in DLP, auth, and compliance on every call
- Real time usage dashboard and cost metering
- Publish to catalog or keep private
Make Your AI Do More
Start with Datadog, then connect any of our 4,800+ other servers whenever your AI needs more. One click, no limits.
- Use this MCP plus 4,800+ others, all in one place
- Add new capabilities to your AI anytime you want
- Every connection is secured and compliant automatically
- Track usage and costs across all your servers
- Works with Claude, ChatGPT, Cursor, and more
- New servers added to the catalog every week
Independent Platform Disclaimer: Vinkius is an independent platform and is not affiliated with, endorsed by, sponsored by, verified by, or otherwise authorized by Datadog. All third-party trademarks, logos, and brand names are the property of their respective owners. Their use on this website is strictly for informational purposes to identify service compatibility and interoperability.
VINKIUS INFRASTRUCTURE
Cloud Hosted
Managed infra
V8 Isolated
Sandboxed per request
Zero-Trust Proxy
No stored credentials
DLP Enforced
Policy on every call
GDPR Compliant
EU data residency
Token Compression
~60% cost reduction
Works with Claude, ChatGPT, Cursor, and more
The Model Context Protocol standardizes how applications expose capabilities to LLMs. Instead of operating in isolation, your AI gains direct access to external platforms, live data, and real-world actions through secure, standardized connections.
This server provides 16 capabilities that interface natively with Claude, ChatGPT, Cursor, and any MCP client. No middleware. No custom integration required.
The struggle of manual observability checks
Today, when a service dips, you open the dashboard. You see a red warning on CPU usage. That leads to opening the log viewer and running basic filters. Then you copy timestamps from the logs into a separate metrics tool just to graph it against the SLO target. It's five tabs, three copies/pastes, and twenty minutes of clicking.
With this MCP, your agent handles the entire sequence in one chat session. You prompt for the failure state, and the agent runs `list_incidents`, pulls relevant logs with `search_logs`, and plots the metrics using `query_metrics`. It gives you a single, consolidated answer without ever leaving the chat window.
Getting deep insight with list_slos
Previously, checking SLOs meant running a dedicated report and waiting for an email. You often had to manually cross-reference which specific metric was tied to the overall 'API Availability' goal. This left you blind until it was too late.
Now, you simply ask your agent to list all SLOs. It instantly provides the current status, remaining error budget, and compliance details for every service. You know where to look for problems before they become incidents.
What you can do with this MCP connector
When an outage hits, you don't have time to click through five different tabs—you just need answers. This connector lets your agent treat Datadog like a command line interface. You can check the current health of monitors, list all active incidents with their severity and timeline, or query specific metrics using complex syntax.
Need to know why? Run log searches across every indexed source, narrowing down 234 errors in minutes. It even lets you see which SLOs are dipping below target and helps manage alert noise by muting unnecessary monitors during maintenance windows. The power comes when your agent chains these actions together; Vinkius AI Analytics gives you full visibility into every step—which metrics were called, what data flowed through, and how much of your budget was used.
You run complex diagnostic workflows against production systems without ever leaving your chat window.
019dd0dc-ff4e-7209-abf7-b03ef00e7665 How Datadog MCP Works
- 1 Connect your Datadog API Key and site URL to this MCP.
- 2 Tell your agent exactly what you need—for example, 'List all SLOs and find the error budget for checkout latency.'
- 3 The agent runs the necessary queries and returns a consolidated report on service health and potential failure points.
The bottom line is: you get full operational visibility into your entire infrastructure stack through plain conversation, skipping the manual dashboard drill-down process.
Who Is Datadog MCP For?
SREs and DevOps engineers who spend too much time clicking through dashboards at 2 a.m. The platform teams that need to validate SLO compliance without running custom scripts.
Needs to list active incidents, search error logs, and check host health instantly during an outage.
Must run metric queries on the fly to validate infrastructure changes or diagnose deployment regressions.
Needs to review SLOs and check host inventory quickly to ensure service compliance across multiple environments.
What Changes When You Connect
- Stop clicking through dashboards. You can run complex diagnostic queries using
query_metricsorsearch_logsdirectly against your live data set. - Control alert fatigue immediately. Use the MCP to list all monitors and then mute specific ones with
mute_monitorduring maintenance windows, keeping your focus on critical alerts. - Validate service health at a glance. Run
list_slosto see which services are nearing their error budget limits without running dedicated reports. - Get immediate incident context. Instead of browsing the dashboard for an active issue, use
get_incidentto pull severity, status, and responder details instantly. - Accelerate root cause analysis. When a problem surfaces, run
search_logswith specific error queries to pinpoint exactly which microservice failed.
Real-World Use Cases
The Production Outage Triage
An alert fires for high latency. Instead of guessing, your agent first runs list_incidents to confirm the scope. Then it uses search_logs with a 'timeout' query and finally executes query_metrics on the P95 metric to prove where the bottleneck is.
Pre-Deployment Readiness Check
Before rolling out code, an engineer runs list_monitors to verify all necessary health checks are active. They then use get_monitor on the critical metrics to ensure baseline performance is met.
Compliance Reporting Audit
A product manager needs proof of uptime. The agent uses list_slos and provides a summary report detailing error budget consumption across key services, proving adherence to SLAs.
Post-Mortem Deep Dive
After an incident, you need data on the failing component. You run list_hosts to inventory the exact machine that failed and then use search_logs targeting that host ID for a complete error trace.
The Tradeoffs
Trying to search everything at once
Asking your agent, 'Tell me about the dashboard, logs, metrics, and incidents.' — This query is too vague and forces the AI to guess which scope you mean.
→
Break it down. First, run list_dashboards to narrow down the area. Then, use get_dashboard on that specific ID. Only after reviewing the dashboard should you proceed with targeted queries like search_logs or query_metrics.
Ignoring SLO boundaries
Fixing a bug without checking if it impacts overall service compliance, leading to unknown budget overruns.
→
Always start by running list_slos. This tells you the current status and remaining error budget before making changes. Don't assume stability.
Forgetting host context
Running a general search_logs query that returns millions of irrelevant logs, wasting time.
→
Always start by using list_hosts to get the specific host ID. Then refine your search with search_logs targeting only that hostname or tag.
When It Fits, When It Doesn't
Use this MCP if you need a single point of truth for operational data, especially when diagnosing an active incident. You must be able to answer: 'What went wrong?' and 'Why did it go wrong?'. This toolset excels at combining metrics (query_metrics), logs (search_logs), and service health checks (list_slos). Don't use this if your goal is purely long-term trend analysis that doesn't relate to current alerts. For pure historical data archiving or compliance reporting without real-time query needs, a dedicated data warehouse tool might be better. If you only need to build static visualizations, listing dashboards via list_dashboards is enough; but if you need the data behind the visualization, this MCP is necessary.
Common Questions About Datadog MCP
How do I use search_logs with Datadog? +
You ask your agent to run search_logs and provide the necessary query syntax, like 'status:error env:production'. The MCP handles the complex API calls so you don't have to worry about formatting.
Can I mute a monitor using list_monitors? +
No. First, use list_monitors or search_monitors to find the correct ID, then ask your agent to execute the mute_monitor tool with that specific ID.
What is the difference between list_metrics and query_metrics? +
Use list_metrics when you just want a catalog of what metrics exist. Use query_metrics when you know the metric name and need to run actual time-series data against it.
Does get_incident provide enough detail for post-mortem? +
It provides core incident details, like status and responders. For a full root cause analysis, you'll want to follow up by running search_logs targeting the time frame provided in the incident record.
How does the `check_datadog_status` tool verify connectivity for my agent? +
It runs a basic API call using your credentials to confirm access. If the status check succeeds, you know the key is valid and the network path is open. This confirms everything works before running complex metric queries.
What's the difference between `list_events` and using the `create_event` tool? +
They do different things. list_events pulls existing platform events for review by your agent. You use create_event when you need your AI client to actively inject a new, custom event with specific tags or priority level.
If I need to find an alert that isn't currently firing, should I just list monitors or use `search_monitors`? +
You should use search_monitors. This tool lets your agent filter the view far beyond just active alerts. You can narrow down monitor results by tags, owner, or status when you're troubleshooting a specific component.
What detailed information does running `list_slos` give me about service health? +
It provides the full picture of Service Level Objectives. For every SLO, your agent retrieves the current success rate, the remaining error budget percentage, and how close you are to exhausting your target.
Use it with your favorite AI tools
Connect this server to Cursor, Claude, VS Code, and more.