GridStatus MCP for AI. Analyze US Grid Load, Pricing, and Fuel Mix Data
 Gemini
 Works with every AI agent you already use
…and any MCP-compatible client
How this MCP server connects to your AI agent
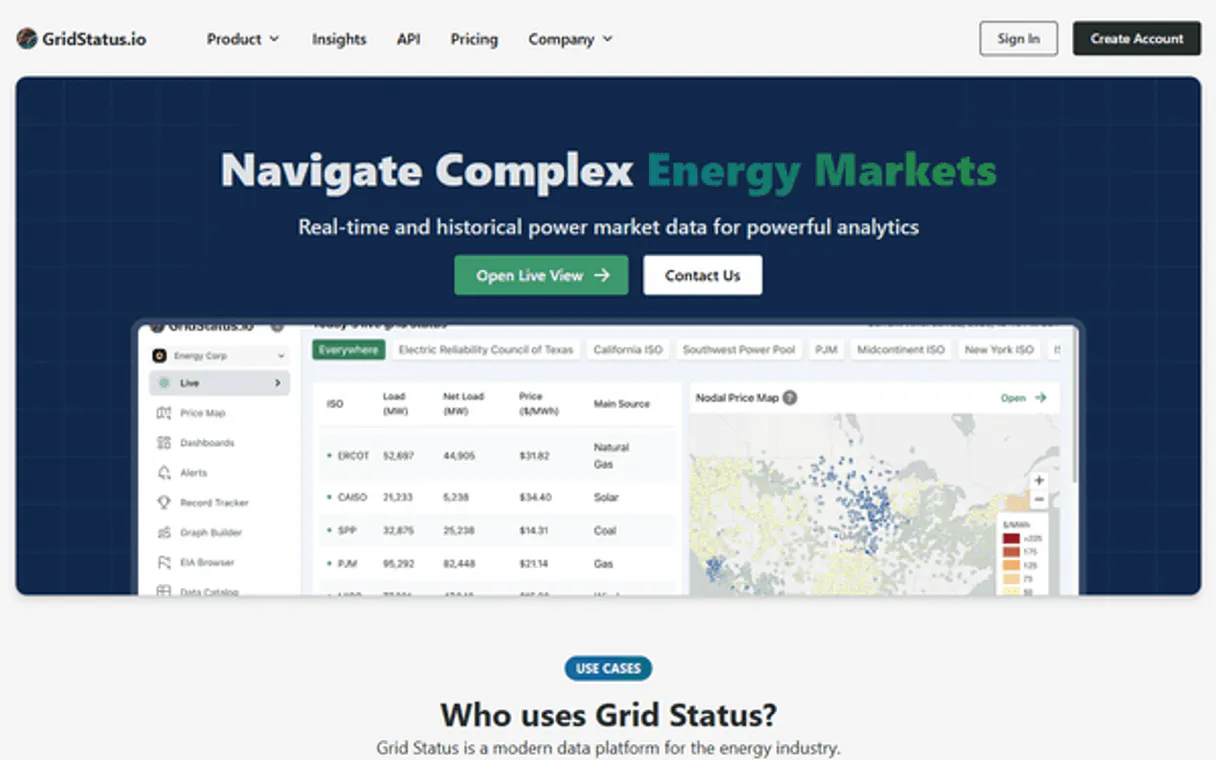
GridStatus gives you deep access to real-time and historical US electricity grid data. Track everything from regional power demand and fuel mix composition to wholesale market pricing (LMP/SPP) across major ISOs like PJM, ERCOT, and CAISO.
What AI agents can do with GridStatus Automation
Get api usage
Retrieves usage statistics and rate limits, telling you how many rows of data you've queried this month.
Get capacity data
Fetches capacity market data for a US Independent System Operator (ISO) to track resource commitments.
Get dataset metadata
Checks the available columns, date range, and schema of any specific GridStatus dataset you plan to query.
Retrieve electricity load data (MW) for any specified region across different time periods.
Get a breakdown of how much power is generated by specific sources, like solar, wind, or natural gas.
Access real-time and day-ahead Locational Marginal Pricing (LMP) forecasts for various grid hubs.
View data related to resource adequacy and long-term generation capacity planning across ISOs.
Run highly filtered queries against specific historical dataset identifiers when specialized tools fall short.
Ask an AI about this
Waiting for input…
What AI agents can do with GridStatus: 12 Data Tools for the Energy Market
These tools let you query everything from real-time pricing to long-term capacity data, making it possible to analyze complex US electricity market dynamics.
Make your AI actually useful.
Add this MCP to Claude, Cursor, or Windsurf and your AI stops guessing. It gets real tools to look things up, take action, and handle the stuff you keep doing by hand.
Start using GridStatus on VinkiusGet Api Usage
Retrieves usage statistics and rate limits, telling you how many rows of data you've queried this month.
Get Capacity Data
Fetches capacity market data for a US Independent System Operator (ISO) to track...
Get Dataset Metadata
Checks the available columns, date range, and schema of any specific GridStatus...
Get Fuel Mix
Provides a generation breakdown by fuel source (coal, solar, wind, etc.) for major...
Get Lmp Data
Retrieves day-ahead Locational Marginal Pricing (LMP) data for various nodes across...
List Datasets
Lists every available dataset, including supported ISOs and the types of data they contain.
Get Load Data
Gets electricity load/demand data for a specific US ISO over a defined time period.
Query Dataset
Runs advanced, custom queries on any GridStatus dataset using precise filters and...
Get Realtime Lmp
Tracks live 5-minute interval LMP data for US ISOs to identify immediate price...
Get Realtime Spp
Shows the most current, granular 15-minute Settlement Point Price (SPP) data...
Get Spp Data
Gets day-ahead hourly SPP forecasts for specific trading hubs and zones across the...
Get Standardized Data
Fetches consistently formatted, standardized hourly data for cross-ISO comparisons and modeling efforts.
Security and governance baked right in.
Pick your AI client below to get set up. Just create a Vinkius account, subscribe, and you're instantly up and running. We handle the entire backend infrastructure, delivering out-of-the-box support for HTTPS Streamable, SSE, and OAuth2—zero messy routing required.
Claude AI
Open Claude Settings
Go to claude.ai, click your profile icon, then navigate to Customize → Connectors.
Add Custom Connector
Click the "+" button and select Add custom connector. Paste your Vinkius endpoint URL:
https://edge.vinkius.com/[YOUR_TOKEN_HERE]/mcp
Replace [YOUR_TOKEN_HERE] with your token
from cloud.vinkius.com. For OAuth-protected servers, expand
Advanced settings to add credentials.
Start a conversation
Open a new chat. The GridStatus integration is available immediately — no restart needed.
Choose How to Get Started
Build a custom MCP for your own tools, or connect a ready-made integration from our catalog.
Build Your Own
Turn any API into an MCP. Import a spec, define Agent Skills, or deploy with MCPFusion.
- Import from OpenAPI, Swagger, or YAML specs
- Create Agent Skills with progressive disclosure
- Deploy to edge with MCPFusion framework
- Built in DLP, auth, and compliance on every call
- Real time usage dashboard and cost metering
- Publish to catalog or keep private
Make Your AI Do More
Start with GridStatus, then connect any of our 5,100+ other servers whenever your AI needs more. One click, no limits.
- Use this MCP plus 5,100+ others, all in one place
- Add new capabilities to your AI anytime you want
- Every connection is secured and compliant automatically
- Track usage and costs across all your servers
- Works with Claude, ChatGPT, Cursor, and more
- New servers added to the catalog every week
Independent Platform Disclaimer: Vinkius is an independent platform and is not affiliated with, endorsed by, sponsored by, verified by, or otherwise authorized by GridStatus. All third-party trademarks, logos, and brand names are the property of their respective owners. Their use on this website is strictly for informational purposes to identify service compatibility and interoperability.
VINKIUS INFRASTRUCTURE
Cloud Hosted
Managed infra
V8 Isolated
Sandboxed per request
Zero-Trust Proxy
No stored credentials
DLP Enforced
Policy on every call
GDPR Compliant
EU data residency
Token Compression
~60% cost reduction
Built on the Model Context Protocol (MCP) for Claude, ChatGPT, Cursor, and more
The Model Context Protocol standardizes how applications expose capabilities to LLMs. Instead of operating in isolation, your AI gains direct access to external platforms, live data, and real-world actions through secure, standardized connections.
This connection provides 12 powerful capabilities that interface natively with Claude, ChatGPT, Cursor, and other compatible AI platforms. No middleware. No custom integration required.
The pain of tracking US energy markets by hand, Solved with Vinkius AI Gateway
Today, checking regional power dynamics means logging into three different vendor portals. You copy load numbers from one dashboard, export pricing data to a second spreadsheet, and then manually cross-reference the fuel mix report from a third site. It's tedious, slow, and you always risk getting outdated data or comparing apples to oranges because of inconsistent schemas.
With this MCP, your agent does the heavy lifting. You just ask for what you need—like 'Compare PJM load against its fuel mix last quarter.' The system pulls the standardized load figures alongside the generation breakdown into one cohesive answer.
Get US Grid Data with GridStatus MCP
Manual data collection means tracking multiple APIs, dealing with different date formats, and spending hours cleaning up disparate datasets. You spend more time writing transformation scripts than doing actual analysis.
Now, you simply prompt your agent. It handles the complexity of multi-ISO coverage, real-time filtering, and standardized zonal querying automatically. The data just appears where you need it.
What your AI can actually do with this
Analyzing the energy markets is complex. You need granular data covering multiple regions, different time scales, and shifting inputs—all at once. This MCP lets your agent pull that intelligence directly. It provides structured access to real-time load measurements (MW), generation breakdowns by source (wind, solar, coal, etc.), and crucial market pricing signals.
Whether you're modeling capacity commitments or just checking the current price spike in Texas, this tool aggregates data from every major Independent System Operator across America. You can query specific historical datasets, check metadata for coverage dates, or analyze standardized zonal trends to build accurate models. By connecting GridStatus through Vinkius, your AI agent becomes an instant energy analyst, delivering actionable insights on US grid dynamics without you ever having to visit a vendor dashboard.
019d75ab-937d-72d3-8616-cde494738577 Here's how it actually works
The bottom line is you get sophisticated US electricity market data delivered via your natural language prompts, instead of through complex dashboards.
First, subscribe to this MCP and provide your GridStatus API key within your AI client.
Next, ask your agent for the specific data you need, like 'What was PJM's load last week?' or 'Show me real-time LMP in CAISO.'
Your agent translates that request into a structured query and returns clean, time-series data ready for immediate analysis.
Who is this actually for?
Energy traders who need to spot arbitrage opportunities; researchers modeling grid transitions; and utility professionals tracking regional capacity. If you deal with wholesale power markets or renewable integration, this is for you.
Uses the MCP to track real-time LMP/SPP prices across different nodes to find immediate arbitrage opportunities.
Queries fuel mix data and standardized zonal metrics over decades to model renewable energy adoption rates and fossil fuel dependency.
Checks capacity market data and load projections for specific ISOs to assess resource adequacy for future planning cycles.
What Changes When You Connect
Eliminate guesswork on pricing. Use the get_realtime_lmp tool to track live 5-minute price spikes in any major ISO, giving you immediate visibility into market volatility.
Understand energy sources instantly. The get_fuel_mix tool breaks down generation by source (solar, wind, etc.), helping you quantify renewable growth across different regions.
Compare apples to apples. Use get_standardized_data to get consistently formatted hourly data for multiple ISOs, making cross-regional modeling straightforward.
Plan ahead with confidence. Check capacity commitments using get_capacity_data to assess resource adequacy and long-term supply stability for specific markets like PJM.
Handle edge cases easily. Instead of failing when a specialized tool doesn't exist, use query_dataset to run custom filters or resampling on any identified dataset.
See it in action
Identifying arbitrage opportunities
An energy trader needs to know if prices are dropping in Texas while remaining high in New York. They ask the agent, and it combines get_realtime_spp (ERCOT) with get_realtime_lmp (NYISO) to show them exactly where the pricing gaps exist right now.
Modeling grid transition impact
A climate researcher wants to know how much cleaner California's grid got last year. They use get_fuel_mix and then combine it with get_standardized_data over a 12-month period, getting clean data for their academic paper.
Checking daily operational load
A utility planner needs to confirm the peak demand in the Midwest (MISO) versus New England (ISO-NE). They use get_load_data on both ISOs for the same date range, allowing them to compare regional stress points.
Forecasting future energy costs
A corporate sustainability team needs to budget for power in Q3. They ask the agent to retrieve day-ahead pricing using get_lmp_data for their target ISOs, allowing them to model future procurement costs.
The honest tradeoffs
Assuming one tool covers everything
Asking the agent simply: 'Give me all energy data.' This is useless because it doesn't know if you need load, pricing, or just metadata.
Always narrow your scope. If you are checking usage, use get_api_usage. If you want to see what datasets exist before asking for anything, run list_datasets first.
Getting stuck on a missing parameter
The agent returns an error because the user didn't specify if they need hourly or 5-minute data. The conversation stalls.
When in doubt, check the schema first. Use get_dataset_metadata to confirm the correct column names and frequency for the dataset you want.
Trying to query non-existent zones
A user asks for 'Utah load data.' The system fails because Utah is not a recognized ISO in this catalog.
Confirm your region. Use list_datasets or get_load_data with the required ISO identifier (e.g., 'miso' or 'pjm') to ensure you are querying supported zones.
When It Fits, When It Doesn't
Use this MCP if your task involves comparing complex, time-series energy data across multiple US Independent System Operators (ISOs) or requires real-time market pricing. You need historical load data AND fuel mix information in the same query flow.
Don't use it if you are only checking a single source of non-energy related metrics. If your goal is just to look up general company contact info, that MCP won't help. Also, if you already have all your required data fields and don't need filtering or resampling (e.g., you just want the raw file), using query_dataset might be overkill; stick to the specialized tools like get_load_data. But for anything involving multiple ISOs or specific time-series analysis, this is the right pick.
Questions you might have
What ISOs does GridStatus cover for load data? +
GridStatus supports major US ISOs including ERCOT (Texas), CAISO (California), PJM, MISO, NYISO, and others. You can use the get_load_data tool specifying any of these identifiers.
How do I check real-time pricing in Texas? +
Use the get_realtime_spp tool. This specifically tracks 15-minute Settlement Point Prices (SPP) across various trading hubs and zones within the ERCOT grid.
Do I need to use a specific tool for fuel mix data? +
Yes, you should use get_fuel_mix. This dedicated tool provides the energy breakdown by source (solar, wind, etc.) across supported ISOs like CAISO and ercot.
What if I need a dataset not covered by the specialized tools? +
If you have a specific data identifier in mind that isn't covered elsewhere, use query_dataset. This tool allows for advanced filtering or resampling on virtually any available GridStatus dataset.
Is this MCP suitable for long-term planning? +
Absolutely. You can monitor capacity commitments using get_capacity_data and use standardized data from the past to model future resource adequacy for your ISOs.
We've already built the connector for GridStatus. Just plug in your AI agents and start using Vinkius.
No hosting. No infrastructure. No complex setup.
All 12 tools are live and waiting.
You're up and running in seconds.
Gemini Vinkius gives your AI agents access to the full catalog of app connectors, all fully managed, secure, and enterprise-ready. One subscription, every tool you need.
Built, hosted, and secured by Vinkius. You just connect and go.