Dotcom-Monitor MCP. Check global uptime and performance instantly.
 Gemini
 Works with every AI agent you already use
…and any MCP-compatible client
Just plug in your AI agents and start using Vinkius.
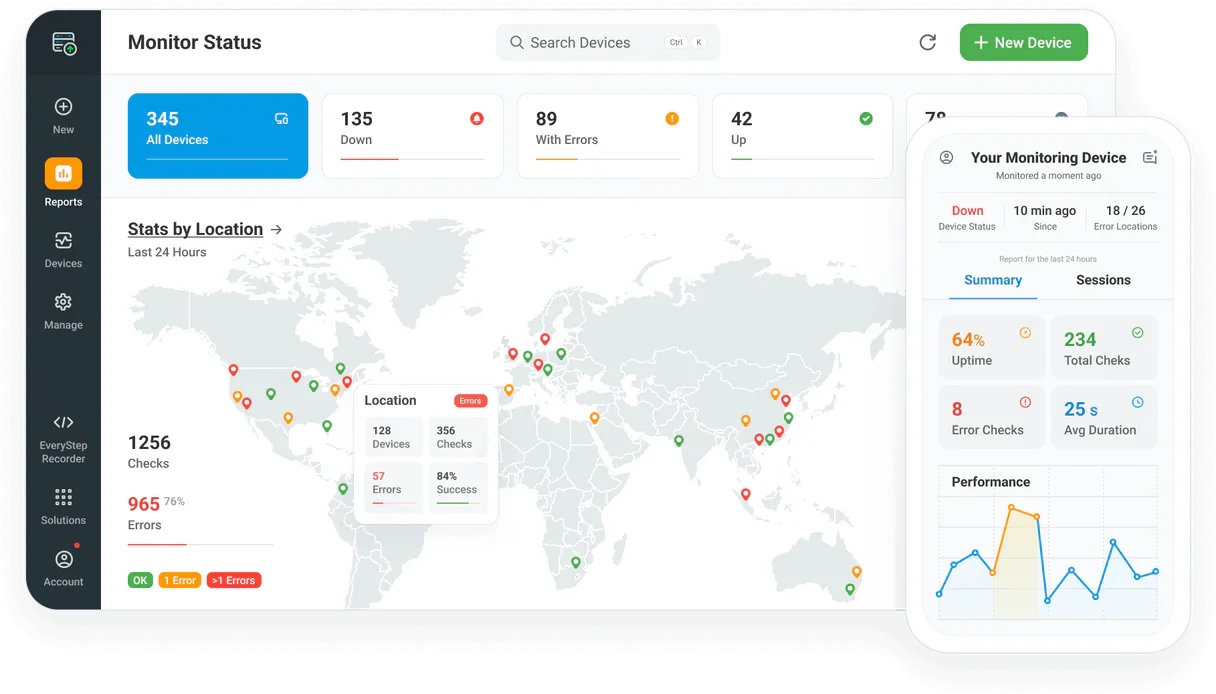
Dotcom-Monitor gives your AI client real-time data on website uptime, page speed, and server health. Check the status of any digital asset from multiple global locations with instant alerts, all through natural conversation.
What your AI agents can do
Get device details
Retrieves specific configuration details about a single monitoring device.
Get device monitoring history
Pulls historical status data for any monitored device over time.
List alert groups
Lists all the configured notification groups and teams in your account.
Retrieves a list of every configured device—including uptime checks, speed tests, or API endpoints.
Pulls detailed status reports and response times over selected time periods to spot slow-down trends.
Lists all geographic points used for monitoring, so you know exactly where the checks are running from.
Checks which notification teams and alert groups are configured to handle incidents.
Provides real-time status updates on a specific monitored endpoint or service.
Ask AI about this MCP
Supported MCP Clients
OAuth 2.0 Compatible Gemini Waiting for input…
Dotcom-Monitor: 6 Tools for Monitoring & Alerting
These tools let your agent access all the necessary information to check device status, list locations, pull history, and manage alerts in one place.
Make your AI actually useful.
Add this MCP to Claude, Cursor, or Windsurf and your AI stops guessing. It gets real tools to look things up, take action, and handle the stuff you keep doing by hand.
Start using Dotcom-Monitor on Vinkius019dd0e4get device details
Retrieves specific configuration details about a single monitoring device.
019dd0e4get device monitoring history
Pulls historical status data for any monitored device over time.
019dd0e4list alert groups
Lists all the configured notification groups and teams in your account.
019dd0e4list monitoring devices
Retrieves a list of all active and configured monitoring devices.
019dd0e4list monitoring locations
Lists every geographic location from which your website checks are running.
019dd0e4list available platforms
Shows which monitoring platforms are available for use in your current setup.
Choose How to Get Started
Build a custom MCP for your own tools, or connect a ready-made integration from our catalog.
Build Your Own
Turn any API into an MCP. Import a spec, define Agent Skills, or deploy with MCPFusion.
- Import from OpenAPI, Swagger, or YAML specs
- Create Agent Skills with progressive disclosure
- Deploy to edge with MCPFusion framework
- Built in DLP, auth, and compliance on every call
- Real time usage dashboard and cost metering
- Publish to catalog or keep private
Make Your AI Do More
Start with Dotcom-Monitor, then connect any of our 5,000+ other servers whenever your AI needs more. One click, no limits.
- Use this MCP plus 5,000+ others, all in one place
- Add new capabilities to your AI anytime you want
- Every connection is secured and compliant automatically
- Track usage and costs across all your servers
- Works with Claude, ChatGPT, Cursor, and more
- New servers added to the catalog every week
Independent Platform Disclaimer: Vinkius is an independent platform and is not affiliated with, endorsed by, sponsored by, verified by, or otherwise authorized by Dotcom-Monitor. All third-party trademarks, logos, and brand names are the property of their respective owners. Their use on this website is strictly for informational purposes to identify service compatibility and interoperability.
VINKIUS INFRASTRUCTURE
Cloud Hosted
Managed infra
V8 Isolated
Sandboxed per request
Zero-Trust Proxy
No stored credentials
DLP Enforced
Policy on every call
GDPR Compliant
EU data residency
Token Compression
~60% cost reduction
Works with Claude, ChatGPT, Cursor, and more
The Model Context Protocol standardizes how applications expose capabilities to LLMs. Instead of operating in isolation, your AI gains direct access to external platforms, live data, and real-world actions through secure, standardized connections.
This server provides 6 capabilities that interface natively with Claude, ChatGPT, Cursor, and any MCP client. No middleware. No custom integration required.
Checking system availability used to be a nightmare of tabs and scripts.
Today, checking your site means opening three different dashboards: one for uptime, one for load speed, and another one that shows API health. You gotta jump between them, cross-reference timestamps, copy the numbers into a spreadsheet, then manually flag which service is causing trouble.
With this MCP, you tell your agent what's wrong or what you want to know—for instance, 'Show me latency trends for the checkout flow.' The agent gathers all that data using background tools and gives you one clean report right in the chat. You just get the answer.
Getting device monitoring history provides deep performance insights.
Before this, finding historical status meant digging into raw logs or running bespoke scripts that only captured uptime percentages. It was tedious and often missed the crucial details about peak load times or average response drift.
Now you can ask for specific time frames and metrics. The agent handles the complex data retrieval using `get_device_monitoring_history`, giving you clear, actionable performance graphs without writing a single query.
What you can do with this MCP connector
Forget jumping between dashboards to check if your site is up or slow. This MCP connects your monitoring account directly to your AI agent, letting you oversee system performance and uptime using simple chat commands. You can ask it to find latency trends from historical data or verify exactly where in the world your checks are running from.
Whether you're checking a single endpoint or managing global alerts, this tool gives you an immediate pulse on your digital assets. All these capabilities live within the Vinkius catalog, making it easy for any MCP-compatible client to access without needing complex integrations. You just talk to your agent and get the facts.
019dd0e4-37b1-7132-9241-804817b87f93 How Dotcom-Monitor MCP Works
- 1 Subscribe to this MCP and enter your Dotcom-Monitor API Key in your Vinkius account settings.
- 2 Connect your preferred AI client (like Cursor or Claude) to the Vinkius catalog and authorize access to this MCP.
- 3 Ask your agent a question, like 'What was the average response time for the checkout page last week?' and get the data back instantly.
The bottom line is, you talk to your AI client; it talks to the monitoring platform; you get the answers in plain language.
Who Is Dotcom-Monitor MCP For?
DevOps engineers and SREs who are tired of switching between multiple dashboards at 2 a.m. IT managers needing centralized visibility into global uptime, or web developers who need rapid feedback on API latency.
Needs to quickly pull up historical performance logs for multiple services and verify device statuses without running separate scripts.
Must monitor global uptime status across all regions and confirm that alert group configurations are correct before a major release.
Needs to check real-time response times for new features or verify API platform availability directly in the chat window.
What Changes When You Connect
- Instead of manually checking multiple dashboards, you can ask the agent for a list of all devices using
list_monitoring_devices. It pulls it together in one chat response. - Need to know why your site was slow last week? Use
get_device_monitoring_historyto pull performance logs and see exactly when latency spiked. This is better than digging through raw database exports. - You never have to wonder if a check is running from the right spot again. Run
list_monitoring_locationsto confirm all your global points are accounted for. - Managing incidents just got easier. You can run
list_alert_groupsto verify which teams get notified, ensuring no one misses an outage alert. - It gives you instant operational status checks. Use the agent to check real-time device health directly, so you know if everything is green or red right now.
Real-World Use Cases
The API endpoint suddenly feels sluggish.
A developer notices a slowdown and asks their agent: 'Show me the performance history for the checkout API.' The agent uses get_device_monitoring_history to pull data, showing that average response time jumped 200ms an hour ago. They immediately know where to focus.
We need to confirm coverage in a new market.
An operations manager asks the agent: 'Do we have monitoring running from Tokyo and Sydney?' The agent uses list_monitoring_locations to list all available regions, confirming they are covered before launching services there.
We're rolling out a new service with multiple endpoints.
A team lead needs to get the full scope of monitoring. They ask for 'all configured monitors.' The agent uses list_monitoring_devices and provides an inventory, including device names and basic details using get_device_details.
We need to check if our alert system is ready.
An IT manager runs 'What are our current notification rules?' The agent uses list_alert_groups to list all configured groups, confirming that the 'Core Infrastructure' team still has Email/SMS alerts enabled.
The Tradeoffs
Running scripts for every check
A user writes a Python script that calls a separate API endpoint just to list devices, then runs another one to get history, and a third to check locations. This is slow, brittle, and requires managing three different keys.
→
Just ask your agent: 'List all active monitoring devices and their current status.' The agent handles the multiple calls internally using tools like list_monitoring_devices and get_device_details, giving you one clean answer.
Confusing platform features
A user tries to manually figure out which monitoring system is used for what by reading raw documentation, leading to confusion about available services.
→
Ask the agent: 'What platforms are we using?' The agent uses list_available_platforms to give you a clean list of all supported systems, so you know exactly where your checks live.
Missing critical context
A developer just asks 'Is the site up?' without specifying which part or timeframe. They get vague answers that require more API calls.
→
Be specific: 'Check the uptime for the /api/v2 endpoint from the East Coast location.' The agent uses get_device_details and combines it with real-time checks.
When It Fits, When It Doesn't
Use this MCP if your main job involves querying, tracking, or reporting on system uptime, performance degradation, or alert status across multiple endpoints. If you need to know if a service is running or how fast it was last week, use the history tools like get_device_monitoring_history. Don't use this if your goal is simply to write new code or manage user permissions; for that, stick to database-native tooling. If you only need a simple status check and don't care about the historical performance data, using the basic device listing tools will suffice. But if you need both current health AND trend analysis, this MCP is what you want.
Common Questions About Dotcom-Monitor MCP
How do I list all active monitoring devices using Dotcom-Monitor MCP? +
You ask the agent to 'List my monitoring devices.' It uses list_monitoring_devices and gives you a full inventory of everything that's currently set up.
Can I check historical performance with Dotcom-Monitor MCP? +
Yes. Use the agent to query history, which triggers get_device_monitoring_history. You can specify time ranges and see metrics like average response times or uptime percentage over days or weeks.
How do I know what global locations are covered by Dotcom-Monitor MCP? +
Simply ask the agent to list available monitoring locations. It uses list_monitoring_locations and gives you a comprehensive map of every region checking your site.
What if I need details for only one device? Should I use Dotcom-Monitor MCP? +
Yes, the agent can get specific details using get_device_details. Just tell it which device name you want information on, and it pulls all the metadata.
When I use `list_alert_groups`, what information can I retrieve about my incident response setup? +
The tool lists all your configured alert groups. You get names, which notification method (Email/SMS or Slack) they use, and who is subscribed to each group.
Using `list_available_platforms`, what kinds of systems can I monitor with Dotcom-Monitor MCP? +
This function lists all supported monitoring technologies. You'll see platforms like ServerView, UserView, and WebAPI, telling you exactly which types of checks are available.
If I need to verify the real-time system connectivity status, how do I use Dotcom-Monitor MCP? +
You check the current health directly through the agent. The MCP reports on immediate device status and verifies if the system is currently connected without needing historical data.
When running `get_device_details`, what specific metadata can I pull for a given monitoring device? +
You retrieve detailed configuration metadata. This includes technical specifics about how the monitor is set up, which helps you fine-tune or audit its current parameters.
Can I check the uptime status of a specific device via AI? +
Yes! Use the get_device_details tool and provide the Device ID. Your agent will retrieve the current operational status and basic performance metrics.
How do I see the history of response times for a monitor? +
Run the get_device_monitoring_history query with your Device ID. The agent will retrieve a historical log of success/failure states and latency data.
Is it possible to list all geographic monitoring locations via AI? +
Absolutely. Use the list_monitoring_locations query. The agent will retrieve the complete list of worldwide regions where Dotcom-Monitor agents are available.
Use it with your favorite AI tools
Connect this server to Cursor, Claude, VS Code, and more.