GDACS MCP. Real-Time Global Disaster Monitoring
 Gemini
 Works with every AI agent you already use
…and any MCP-compatible client
Just plug in your AI agents and start using Vinkius.
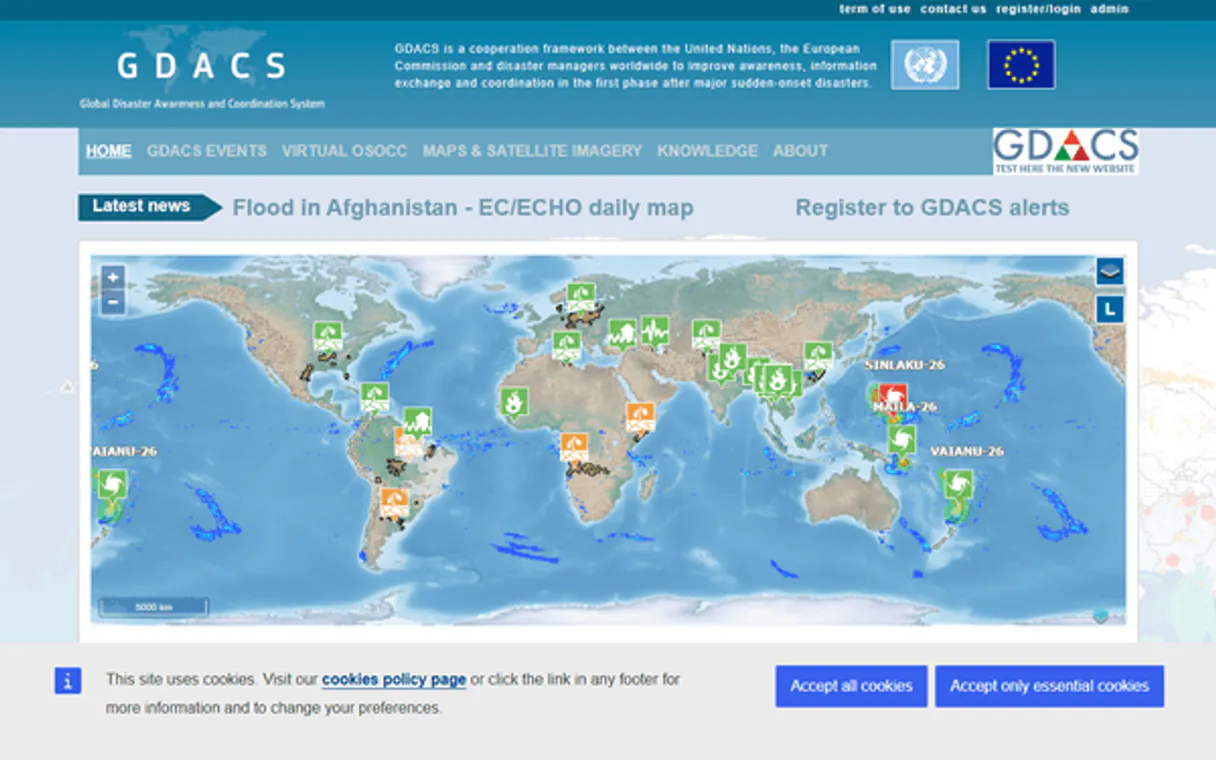
GDACS monitors global disaster alerts in real time—tracking everything from earthquakes and cyclones to floods, volcanoes, wildfires, and droughts. It provides detailed impact estimates on population exposure, estimated fatalities, and economic losses for immediate risk assessment.
What your AI agents can do
Get alert detail
Retrieves specific details about a single, identified disaster alert.
Get alerts
Gathers all active disaster alerts globally, allowing filtering by event type and time period to show severity levels.
Get event detail
Pulls comprehensive information on a specific historical or current disaster event.
Get detailed estimates on population affected, expected fatalities, and economic damage for any specific disaster event.
Track active events across all hazard types (cyclones, earthquakes, floods, etc.), filtering by location or time period.
Retrieve the precise geoJSON boundaries and affected areas for a disaster event to map on GIS platforms.
Instantly pull up real-time lists of active cyclones, earthquakes, or droughts worldwide with current metrics like wind speed or magnitude.
Retrieve full context and specific data points for a single, known disaster event.
Ask AI about this MCP
Supported MCP Clients
OAuth 2.0 Compatible Gemini Waiting for input…
GDACS: 12 Tools for Hazard Analysis
Use these tools to gather specific data points about event types, impact calculations, geographic boundaries, or the latest activity across every major global hazard.
Make your AI actually useful.
Add this MCP to Claude, Cursor, or Windsurf and your AI stops guessing. It gets real tools to look things up, take action, and handle the stuff you keep doing by hand.
Start using GDACS on Vinkius019d843eget alert detail
Retrieves specific details about a single, identified disaster alert.
019d843eget alerts
Gathers all active disaster alerts globally, allowing filtering by event type and time period to show severity levels.
019d843eget event detail
Pulls comprehensive information on a specific historical or current disaster event.
019d843eget event geojson
Returns the exact geographical boundaries and affected area polygons for a chosen disaster event.
019d843eget event list
Searches for historical or current disaster events by filtering types, date ranges, and times to get names and alert levels.
019d843eget impacts
Calculates the estimated human and economic impact, including population affected and losses, for a specific event.
019d843eget latest cyclones
Provides current data on active tropical cyclones worldwide, including their category, wind speed, and forecast tracks.
019d843eget latest droughts
Lists the most recent drought events globally, detailing start dates, severity levels, and affected populations.
019d843eget latest earthquakes
Fetches records of the latest earthquakes worldwide, including magnitude, depth, location, and alert level.
019d843eget latest floods
Gives details on recent flood events, reporting locations, affected populations, and severity estimates.
019d843eget latest volcanoes
Tracks the latest volcanic activity globally, including eruption types, alert levels, and ash plume data.
019d843eget latest wildfires
Reports on recent wildfires worldwide, listing locations, burned areas, affected populations, and current alert levels.
Choose How to Get Started
Build a custom MCP for your own tools, or connect a ready-made integration from our catalog.
Build Your Own
Turn any API into an MCP. Import a spec, define Agent Skills, or deploy with MCPFusion.
- Import from OpenAPI, Swagger, or YAML specs
- Create Agent Skills with progressive disclosure
- Deploy to edge with MCPFusion framework
- Built in DLP, auth, and compliance on every call
- Real time usage dashboard and cost metering
- Publish to catalog or keep private
Make Your AI Do More
Start with GDACS, then connect any of our 4,900+ other servers whenever your AI needs more. One click, no limits.
- Use this MCP plus 4,900+ others, all in one place
- Add new capabilities to your AI anytime you want
- Every connection is secured and compliant automatically
- Track usage and costs across all your servers
- Works with Claude, ChatGPT, Cursor, and more
- New servers added to the catalog every week
Independent Platform Disclaimer: Vinkius is an independent platform and is not affiliated with, endorsed by, sponsored by, verified by, or otherwise authorized by GDACS. All third-party trademarks, logos, and brand names are the property of their respective owners. Their use on this website is strictly for informational purposes to identify service compatibility and interoperability.
VINKIUS INFRASTRUCTURE
Cloud Hosted
Managed infra
V8 Isolated
Sandboxed per request
Zero-Trust Proxy
No stored credentials
DLP Enforced
Policy on every call
GDPR Compliant
EU data residency
Token Compression
~60% cost reduction
Works with Claude, ChatGPT, Cursor, and more
The Model Context Protocol standardizes how applications expose capabilities to LLMs. Instead of operating in isolation, your AI gains direct access to external platforms, live data, and real-world actions through secure, standardized connections.
This server provides 12 capabilities that interface natively with Claude, ChatGPT, Cursor, and any MCP client. No middleware. No custom integration required.
The Manual Data Dump
Right now, getting a full picture of regional risk means opening six different tabs: one for USGS seismic activity, another for NOAA's cyclone tracking, and three more for local flood reports. You spend time cross-checking magnitudes against population density maps, copying dates into spreadsheets, and manually adjusting severity levels—it’s slow and prone to human error.
With this MCP, you ask your agent a single question: 'What is the current overall risk in Region X?' It runs all necessary checks, pulling data from tools like `get_latest_earthquakes` and `get_latest_floods`. You get one synthesized answer that already includes impact estimates and severity ratings.
Using the GDACS MCP for Geospatial Analysis
You used to have to find a general alert, then manually search an annex or external database for the affected boundaries. If you missed that step, your entire risk model was inaccurate because you didn't know the precise footprint of the damage.
Now, after identifying any event using `get_event_list`, you run `get_event_geojson`. This instantly gives you the exact geographic boundaries and population polygons needed for mapping. The data moves from abstract warning to actionable map layer.
What you can do with this MCP connector
When a major event hits, getting a clear picture of the scale is hard. You don't have time to jump between NOAA reports, USGS feeds, and local news sites. This MCP connects you directly to the Global Disaster Alert and Coordination System. Instead of sifting through separate data streams, your AI client pulls everything together: tracking current cyclone paths alongside historical flood levels or calculating population exposure from a recent volcanic plume.
You can ask for an overview of all active hazards in a region, and it returns color-coded alerts with specific severity estimates. It’s designed to give emergency managers and analysts one single source of truth. When you connect this MCP via Vinkius, your agent handles the complex querying across multiple hazard types—it's instant situational awareness.
019d843e-6548-7276-9354-1d0828fbbac9 How GDACS MCP Works
- 1 Connect this MCP to your preferred AI client in the Vinkius catalog.
- 2 Prompt your agent with your query (e.g., 'Show me all high-impact flood alerts in Southeast Asia last week').
- 3 The MCP automatically runs multiple tools, gathers disparate data points, and synthesizes a single report for you.
The bottom line is that it converts complex, multi-source disaster research into simple, actionable text output.
Who Is GDACS MCP For?
This MCP is essential for emergency managers who need to synthesize data fast. It's for researchers building models of climate risk and journalists needing verified impact numbers immediately.
Needs real-time, cross-hazard tracking during an active crisis to coordinate immediate resource deployment.
Analyzes historical patterns and correlates different hazard types (e.g., drought followed by wildfire) across regions over years.
Assesses regional catastrophe risk exposure by pulling official records of previous flood damage and population density metrics.
What Changes When You Connect
- Consolidate data from disparate sources. Instead of manually checking separate feeds for earthquakes and floods, your agent combines the results into one cohesive report.
- Quantify risk instantly. Use the
get_impactstool to move past simple alerts; you get estimates on economic loss and population exposure immediately after an event is identified. - Pinpoint affected areas with precision. The ability to retrieve geoJSON data means you can map boundaries and affected zones directly into your GIS software.
- Maintain situational awareness across all hazards. Use tools like
get_latest_cyclonesalongsideget_latest_wildfiresto track multiple, simultaneous threats in a single workflow. - Streamline initial triage. Start by using the general alert function (
get_alerts) to quickly filter and prioritize high-impact events before digging into specific details.
Real-World Use Cases
Assessing Post-Tropical Cyclone Impact
A disaster analyst needs to know if a recent cyclone (tracked via get_latest_cyclones) has increased the risk of secondary flooding. They prompt their agent: 'What is the impact on coastal regions impacted by Cyclone X?' The MCP combines the storm data with flood models and uses the get_impacts tool to provide an immediate, combined loss assessment.
Cross-referencing Drought and Fire Risk
A researcher is modeling long-term climate risk. They ask their agent to compare recent drought activity (get_latest_droughts) with active wildfire events (get_latest_wildfires) in the same area over the last six months, allowing them to correlate severity levels and population impact.
Rapid Initial Response Triage
An emergency responder receives a report of seismic activity. They immediately run get_latest_earthquakes to confirm magnitude and depth. Next, they use the coordinates from the event detail (get_event_geojson) to check for concurrent flood risks in that exact region.
Journalistic Reporting on Major Events
A journalist needs hard numbers for a breaking story about volcanic activity. They request data using get_latest_volcanoes and then follow up with get_event_detail to pull verifiable historical context, ensuring the report is backed by official data.
The Tradeoffs
Using Google Search
Manually visiting multiple government sites and copying/pasting varying reports on flood levels, earthquake magnitudes, and fire burn areas.
→
Use the MCP. Instead of searching for each hazard type separately, ask your agent to run get_alerts first, then drill down using specific tools like get_latest_floods or get_latest_earthquakes.
Relying on single-source data
Only looking at the alert level provided by one agency (e.g., only seeing 'green' for a wildfire) without understanding the potential population impact.
→
Always use get_impacts in conjunction with hazard listings. This gives you the estimated human and economic losses, providing context beyond just the color-coded alert.
Ignoring geospatial data
Getting a general warning that an area is affected by a volcano but not knowing the precise boundaries of risk.
→
Use get_event_geojson to pull the exact geographic polygons. This lets you map the boundary and precisely determine which populations are in play.
When It Fits, When It Doesn't
Use this MCP if your goal is synthesizing complex, multi-hazard situational reports (e.g., 'What is the risk from a cyclone interacting with existing drought patterns?'). You need to correlate data points: comparing get_latest_cyclones metrics against population estimates or analyzing historical trends using get_event_list. Don't use this if you just need simple, single-source information. If your only goal is to find the latest wind speed for a known storm, calling get_latest_cyclones alone is enough. But if you need that data plus population exposure and historical context, this MCP handles the orchestration.
Common Questions About GDACS MCP
How do I find out about historical major floods using get_event_list? +
You use get_event_list and filter the event type code for 'FL' (flood). You can also refine the date range to narrow your search, then follow up with get_event_detail for full reports.
Does get_impacts only cover human casualties? +
No. The tool provides a comprehensive estimate that includes population affected, estimated fatalities, and calculated economic losses, giving you a complete financial picture of the disaster.
Can I check for multiple hazard types at once with get_alerts? +
Yes. get_alerts lets you see all active hazards in one view. You can filter by time or region to prioritize what needs attention immediately across different disaster categories.
What if I need boundaries for a volcano event? +
You first identify the volcano using get_latest_volcanoes and then use get_event_geojson on that specific event to pull the precise affected area polygons.
When I run get_event_geojson, what does it return regarding affected areas and boundaries? +
It returns precise geographic data. The function gives you polygons that map out the event's exact boundaries, affected zones, and population exposure area.
Does get_latest_earthquakes support filtering events by a minimum required magnitude and time span? +
Yes, it lets you specify both a minimum magnitude and number of days. This narrows the results so you only see seismic activity that meets your specific criteria.
When I use get_alert_detail, what criteria determine if an event receives a red, orange, or green alert level? +
The alert levels are assigned based on assessed impact severity. Red indicates high risk, orange suggests medium impact, and green shows low potential for the specified disaster.
Does get_latest_cyclones provide sustained wind speeds and forecast tracks for active storms? +
Yes, it returns the cyclone's name, category, current location, alert level, as well as key data like sustained wind speeds and projected track paths.
Use it with your favorite AI tools
Connect this server to Cursor, Claude, VS Code, and more.