Analyze American electricity grid pricing and flow.  Claude
  ChatGPT
  Cursor
  Gemini
  Windsurf
  VS Code
  JetBrains
  Vercel
Gemini Works with every AI agent you already use
…and any MCP-compatible client
Connect to your AI in seconds.
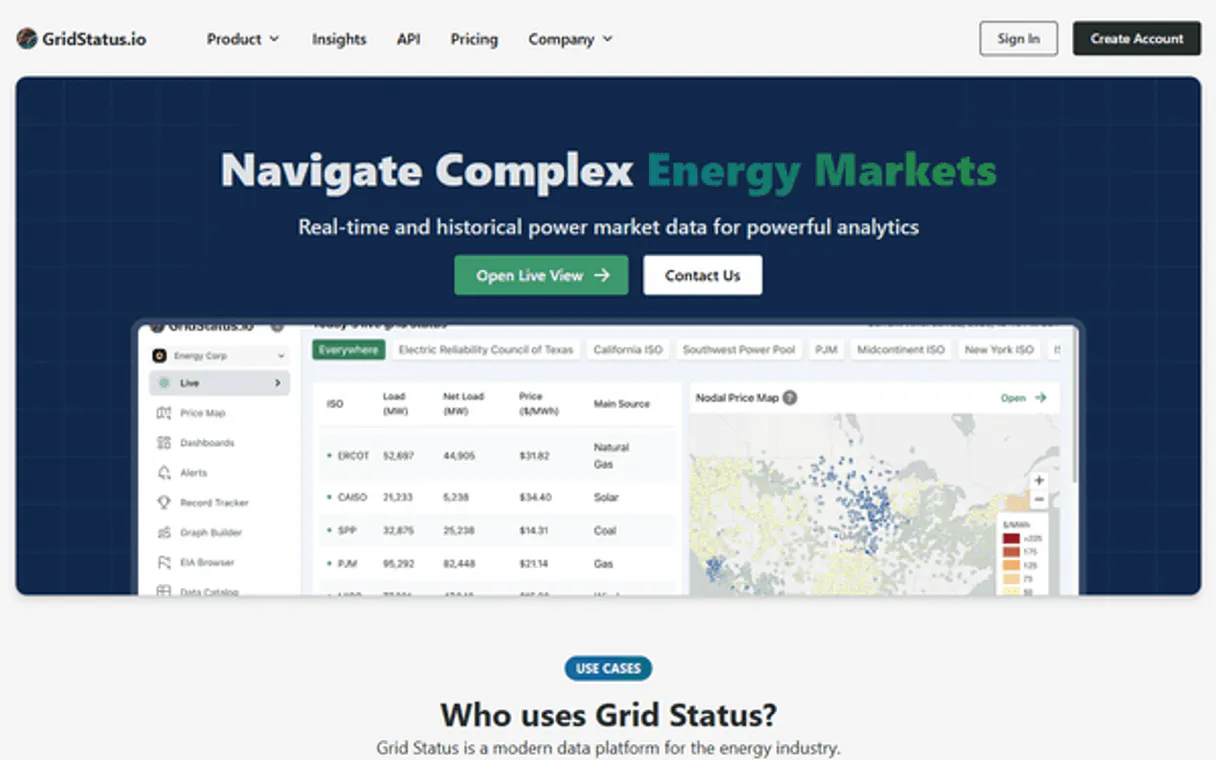
GridStatus provides access to real-time and historical US electricity grid data, covering everything from consumption load to wholesale pricing across major ISOs like ERCOT, CAISO, and PJM.
You track fuel mix breakdowns (solar, wind, gas), monitor Locational Marginal Pricing (LMP) at 5-minute intervals, and analyze capacity commitments for the entire American energy market.
What your AI can do
Get api usage
Checks how many rows you've queried and shows your remaining data quota.
Get capacity data
Retrieves resource adequacy metrics and capacity commitment data for a specific US ISO.
Get dataset metadata
Lists the date ranges, available columns, and schema details for any specified dataset.
Get live, 5-minute interval wholesale prices (LMP/SPP) at specific nodes across multiple US ISOs.
Determine the power generation breakdown by fuel source—like solar versus gas—for any supported region.
Retrieve historical or current total electricity load consumption for a specific US ISO region.
Check resource adequacy data and capacity commitments necessary for future grid planning.
Query day-ahead or real-time prices across different ISOs, enabling cross-market comparisons.
Ask an AI about this
Compatible AI Apps
OAuth 2.0 Compatible Gemini Waiting for input…
GridStatus: 12 Tools for Energy Market Intelligence
Use these tools to query everything from historical load patterns to live 5-minute LMP prices across the entire American energy grid.
Make your AI actually useful.
Add this MCP to Claude, Cursor, or Windsurf and your AI stops guessing. It gets real tools to look things up, take action, and handle the stuff you keep doing by hand.
Start using GridStatus on VinkiusGet Api Usage
Checks how many rows you've queried and shows your remaining data quota.
Get Capacity Data
Retrieves resource adequacy metrics and capacity commitment data for a specific US...
Get Dataset Metadata
Lists the date ranges, available columns, and schema details for any specified...
Get Fuel Mix
Provides a breakdown of power generation by source (coal, wind, solar, etc.) for a...
Get Lmp Data
Gathers day-ahead Locational Marginal Pricing (LMP) data across multiple nodes and...
List Datasets
Lists all available datasets in the GridStatus API, including supported ISOs and data types.
Get Load Data
Shows the total electricity demand or consumption metrics for a specific US ISO region over time.
Query Dataset
Allows you to query any specific dataset with advanced filtering, resampling, or...
Get Realtime Lmp
Delivers 5-minute interval wholesale electricity prices in real-time across multiple...
Get Realtime Spp
Tracks the most current, 15-minute Settlement Point Price (SPP) data for the Texas...
Get Spp Data
Retrieves day-ahead hourly Settlement Point Price (SPP) forecasts specifically for...
Get Standardized Data
Fetches standardized, consistently formatted hourly data with uniform regional breakdowns across different ISOs.
Connect to your AI in seconds. Security and governance baked right in.
Pick your AI client below to get set up. Just create a Vinkius account, subscribe, and you're instantly up and running. We handle the entire backend infrastructure, delivering out-of-the-box support for HTTPS Streamable, SSE, and OAuth2—zero messy routing required.
Claude AI
Open Claude Settings
Go to claude.ai, click your profile icon, then navigate to Customize → Connectors.
Add Custom Connector
Click the "+" button and select Add custom connector. Paste your Vinkius endpoint URL:
https://edge.vinkius.com/[YOUR_TOKEN_HERE]/mcp
Replace [YOUR_TOKEN_HERE] with your token
from cloud.vinkius.com. For OAuth-protected servers, expand
Advanced settings to add credentials.
Start a conversation
Open a new chat. The GridStatus integration is available immediately — no restart needed.
Choose How to Get Started
Build a custom MCP for your own tools, or connect a ready-made integration from our catalog.
Build Your Own
Turn any API into an MCP. Import a spec, define Agent Skills, or deploy with MCPFusion.
- Import from OpenAPI, Swagger, or YAML specs
- Create Agent Skills with progressive disclosure
- Deploy to edge with MCPFusion framework
- Built in DLP, auth, and compliance on every call
- Real time usage dashboard and cost metering
- Publish to catalog or keep private
Make Your AI Do More
Start with GridStatus, then connect any of our 5,000+ other servers whenever your AI needs more. One click, no limits.
- Use this MCP plus 5,000+ others, all in one place
- Add new capabilities to your AI anytime you want
- Every connection is secured and compliant automatically
- Track usage and costs across all your servers
- Works with Claude, ChatGPT, Cursor, and more
- New servers added to the catalog every week
Independent Platform Disclaimer: Vinkius is an independent platform and is not affiliated with, endorsed by, sponsored by, verified by, or otherwise authorized by GridStatus. All third-party trademarks, logos, and brand names are the property of their respective owners. Their use on this website is strictly for informational purposes to identify service compatibility and interoperability.
VINKIUS INFRASTRUCTURE
Cloud Hosted
Managed infra
V8 Isolated
Sandboxed per request
Zero-Trust Proxy
No stored credentials
DLP Enforced
Policy on every call
GDPR Compliant
EU data residency
Token Compression
~60% cost reduction
Works with Claude, ChatGPT, Cursor, and more
The Model Context Protocol standardizes how applications expose capabilities to LLMs. Instead of operating in isolation, your AI gains direct access to external platforms, live data, and real-world actions through secure, standardized connections.
This connection provides 12 powerful capabilities that interface natively with Claude, ChatGPT, Cursor, and other compatible AI platforms. No middleware. No custom integration required.
The current process for tracking energy prices is fragmented and slow.
Today, figuring out the true cost or supply of electricity requires jumping between multiple regional utility websites. You check CAISO's site for California load, then PJM’s dashboard for the Mid-Atlantic price, and maybe a separate feed for ERCOT's settlement points. It takes hours just to gather the raw data, let alone build an accurate picture.
With this MCP, you ask your agent one question—for example, 'How does California's load compare to Texas’s right now?' Your AI client handles the calls to get_load_data and get_realtime_spp, compiling a clean answer in seconds. The result is a single, unified view of market dynamics across major ISOs.
get_fuel_mix: See exactly what powers the grid.
Before this MCP, determining the energy mix was often guesswork or relied on single-source reports that didn't update in real time. You couldn't easily compare a region's reliance on fossil fuels versus renewables across different months or ISOs.
Now, you simply ask for the fuel mix using get_fuel_mix. Your agent returns a precise breakdown—telling you exactly what percentage of power is coming from wind vs. natural gas right now. You instantly have the data needed to track the renewable energy transition.
What your AI can actually do with this
The GridStatus MCP lets your AI client become an instant US energy analyst. Instead of manually checking multiple regional websites or wrestling with complicated data feeds, you query a single source to understand how America's power grid operates in real time. You can track current electricity consumption across any major ISO, see exactly which fuel sources—be it solar, natural gas, or coal—are powering the region, and analyze wholesale prices at specific trading hubs.
This level of granular detail is critical for anyone tracking the energy transition or managing risk. With Vinkius, you connect this specialized data source once from your preferred AI client, giving your agent immediate access to a massive catalog of market intelligence, making complex grid analysis simple.
It's all about understanding dynamics—watching how high wind output affects pricing in New York versus tracking the daily load patterns in Texas. You get a complete picture without ever leaving your chat window.
019d75ab-937d-72d3-8616-cde494738577 Here's how it actually works
The bottom line is you don’t write code; you ask questions, and the MCP does the heavy lifting to retrieve precise market data.
Subscribe to this MCP and enter your GridStatus API key into Vinkius.
Connect your preferred AI client (like Claude or Cursor) to the Vinkius platform.
Ask your agent a natural language question, like 'What's the current load in Texas?' and let it use the available tools.
Who is this actually for?
Anyone whose job depends on knowing where power comes from and what it costs right now. If your work involves risk assessment, energy forecasting, or optimizing infrastructure placement, you need this.
Needs to monitor real-time LMP/SPP prices across multiple nodes to spot arbitrage opportunities before they vanish.
Must track regional renewable availability and fuel mix evolution to advise clients on optimal, clean facility siting.
Requires historical load data and capacity commitments to model grid stress points or plan for future expansion in a specific ISO.
What Changes When You Connect
Spot price spikes using get_realtime_lmp: Don't guess when prices will jump. This tool tracks live, 5-minute nodal pricing, letting your agent identify exactly when demand causes major cost swings.
Map the energy transition with get_fuel_mix: Need to know if California is running on wind or gas today? This capability breaks down generation by source, giving you a clear picture of regional decarbonization efforts.
Model future load using get_load_data: Don't rely on rough estimates. By fetching historical and current consumption data for an ISO, you can build accurate demand forecasts for capacity planning.
Compare markets with get_lmp_data: Need to know if PJM is cheaper than MISO tomorrow? You use this tool to gather day-ahead pricing across multiple regions simultaneously, making cross-market arbitrage decisions.
Validate your data structure using list_datasets: Before building a complex query, you can run list_datasets. This helps you discover every available dataset ID and supported ISO right away.
See it in action
Assessing Texas grid stability
A policy advocate needs to know if ERCOT is facing supply stress. They ask their agent, which uses get_realtime_spp and get_load_data, to compare current load against live settlement point prices across key hubs.
Researching clean energy impact
An academic wants to study how solar growth affects wholesale costs. They use get_fuel_mix in conjunction with query_dataset and filter for specific ISOs to build a comprehensive, longitudinal model.
Optimizing corporate procurement
A sustainability team needs to know when electricity is cheapest and cleanest. They run get_lmp_data alongside get_fuel_mix to find periods where low prices coincide with high renewable generation in their target ISO.
Forecasting regional peak demand
An engineering firm needs a reliable estimate of next quarter's load. They use get_load_data, specifying the desired start and end dates, to generate structured historical data for their internal forecasting models.
The honest tradeoffs
Treating all pricing as one metric
Asking 'What is the price?' without specifying if you mean day-ahead forecasts or real-time spikes. This leads to ambiguous data and incorrect assumptions.
Always specify your time window and market type. For live volatility, use get_realtime_lmp; for next week's forecast, use get_lmp_data. Never assume 'price' means the same thing in different ISOs.
Guessing a dataset ID
Trying to query a dataset like 'caiso_load' without knowing if it exists or what columns it has, causing the agent to fail with an invalid identifier.
Before querying anything custom, run list_datasets. This confirms all supported ISOs and available data types are correct.
Ignoring geographical boundaries
Running a single query assuming the price of power in New York is comparable to Texas without filtering by settlement point or zone.
Always specify the ISO, and if possible, use filter_column/filter_value parameters (like those available in get_realtime_spp) to focus on specific trading hubs.
When It Fits, When It Doesn't
Use this MCP if your core question involves where power is consumed, how much it costs right now, or what mix of energy created it. Specifically, if you need real-time monitoring, use get_realtime_lmp or get_realtime_spp. If you are building a long-term model, start with list_datasets to map out your data sources before running get_load_data for historical trends. Don't use this MCP if you only need general global commodity price indices; stick to specialized financial market tools instead. For simple metadata checks, rely on get_dataset_metadata rather than a broad query.
Questions you might have
What does get_realtime_lmp do? +
get_realtime_lmp tracks live wholesale electricity prices at 5-minute intervals. It's what you use when you need to see price spikes or volatility in the US grid right now.
How do I list all available datasets with list_datasets? +
list_datasets gives you a comprehensive list of every dataset ID and supported ISO, letting you know exactly what data types (load, fuel_mix, lmp) are available to query.
Can I compare loads across different regions using get_load_data? +
Yes. By calling get_load_data with multiple ISO identifiers and a shared date range, you can easily pull comparative consumption metrics for different parts of the US.
What is the difference between get_lmp_data and get_realtime_lmp? +
get_lmp_data handles day-ahead forecasts (planned prices), while get_realtime_lmp provides the actual, live 5-minute pricing data. Use them for different planning horizons.
How do I check my usage with get_api_usage? +
get_api_usage shows your current row counts and remaining quota allowance, preventing you from hitting rate limits mid-analysis.
How can I use `get_fuel_mix` to track renewable adoption over several years? +
It retrieves the generation breakdown by source (solar, wind, etc.) for a given ISO. You'll need to set specific start and end dates in the call parameters to see how the energy mix has changed across time periods.
What are the necessary parameters when calling `get_capacity_data`? +
The required parameter is the ISO identifier (like 'pjm'). You can further refine results by providing optional start and end dates, or limiting the row count to focus on specific commitment periods.
Why should I use `get_standardized_data` instead of querying load directly? +
This MCP guarantees that all returned data has a uniform schema and consistent column names. It’s the best tool for cross-ISO comparisons or when you need clean, standardized data ready for modeling.
Which US electricity grid operators (ISOs) are supported? +
The GridStatus API supports all major US Independent System Operators: ERCOT (Texas), CAISO (California), PJM (Mid-Atlantic/Midwest), MISO (Midwest), NYISO (New York), ISO-NE (New England), and SPP (Southwest/Central). Each ISO provides different datasets including load, fuel mix, LMP pricing, and standardized data depending on what they report.
How do I get a GridStatus API key and what are the usage limits? +
Visit https://www.gridstatus.io/ and create a free account. Your API key will be available in your account settings. The free tier includes 500,000 rows per month, which is sufficient for most research and analysis use cases. Use the get_api_usage tool to monitor your remaining quota. Higher tiers are available for commercial applications requiring more data access.
What is the difference between LMP and SPP pricing data? +
LMP (Locational Marginal Pricing) is used by most ISOs (PJM, CAISO, MISO, NYISO, ISO-NE, SPP) and represents the wholesale electricity price at specific nodes. SPP (Settlement Point Price) is ERCOT's equivalent for Texas. Both measure $/MWh but use different market mechanisms. LMP has day-ahead hourly and real-time 5-minute intervals. ERCOT SPP has day-ahead hourly and real-time 15-minute intervals. Both include prices at trading hubs (e.g. HB_HOUSTON, HB_NORTH), load zones, and resource zones.
Can I get renewable energy percentage data from the fuel mix? +
Yes! Use the get_fuel_mix tool with ISOs that support it (ERCOT, CAISO, ISO-NE). The response includes generation breakdown by source: solar, wind, hydro, natural_gas, coal, nuclear, and others. You can calculate the renewable percentage by summing solar + wind + hydro and dividing by total generation. Note that fuel mix data availability varies by ISO — ERCOT and CAISO have the most comprehensive renewable tracking.
We've already built the connector for GridStatus. Just plug in your AI agents and start using Vinkius.
No hosting. No infrastructure. No complex setup.
All 12 tools are live and waiting.
You're up and running in seconds.
Gemini Vinkius gives your AI agents access to the full catalog of app connectors, all fully managed, secure, and enterprise-ready. One subscription, every tool you need.
Built, hosted, and secured by Vinkius. You just connect and go.