Honeycomb MCP for AI Agents. Query Complex Observability Data via Chat
Honeycomb MCP gives your AI agent full control over your observability data. Connect to Honeycomb.io from any compatible client to manage datasets, run complex queries, inspect schemas, and automate timeline markers using natural conversation.
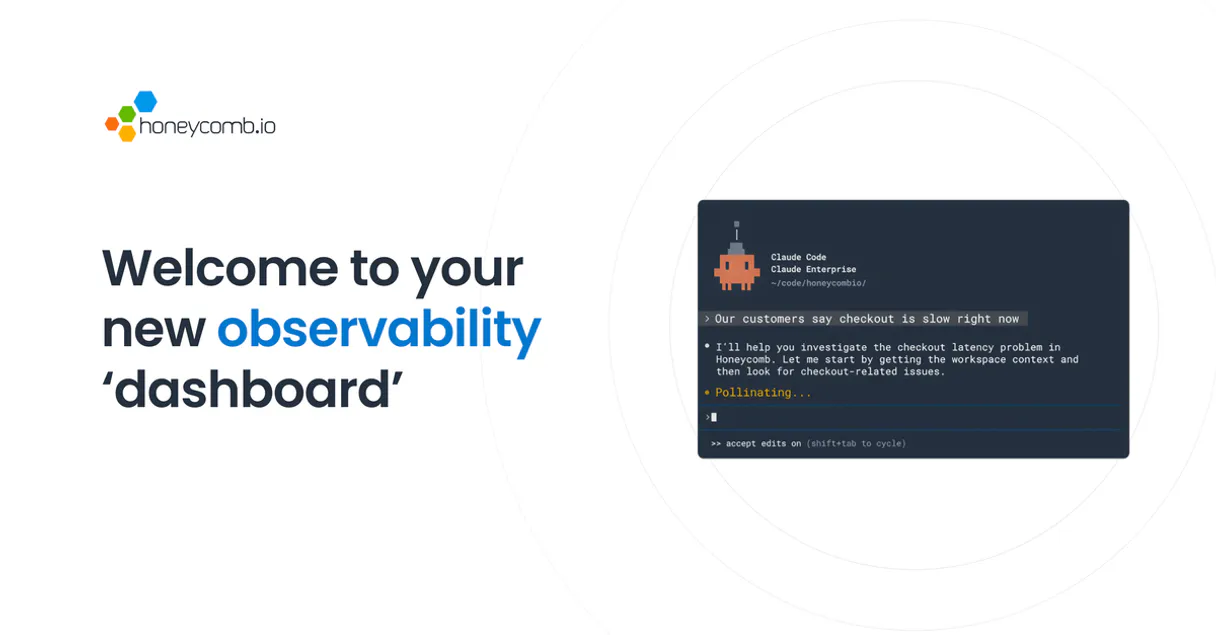
Give Claude and any AI agent real-world access
The agent retrieves metadata and access times for all datasets in your account.
You execute complex query specifications, receiving a result ID you can later use to retrieve the final data set.
The system creates permanent markers on your dataset timeline for events like deployments or outages.
You list and view the specific columns (fields) contained within any given dataset.
The agent pulls information about shared boards and your Honeycomb team settings.
Ask an AI about this
Waiting for input…
What AI agents can do with Honeycomb with 12 Tools
These twelve tools allow your AI client to perform every critical operation on your observability data, from listing schemas to running deep performance analytics.
Make your AI actually useful.
Add this MCP to Claude, Cursor, or Windsurf and your AI stops guessing. It gets real tools to look things up, take action, and handle the stuff you keep doing by hand.
Start using Honeycomb MCPCreate Marker
Adds a permanent annotation, like a deployment or maintenance window, directly onto a dataset's timeline.
Create Query Specification
Generates a formal query definition for a specific dataset, which you can then run...
Run Query
Executes the defined query specification and returns a unique result ID that tracks...
Get Dataset Details
Pulls general metadata about any specific dataset you are interested in.
Get Team Details
Retrieves organizational information, including details about the connected...
Get Query Result
Fetches and displays the final data results using a query result ID you previously received.
List Honeycomb Boards
Lists all shared dashboards or boards that are visible to your team configuration.
List Dataset Columns
Displays a list of every column (field) available within a specified dataset's...
List Datasets
Provides a comprehensive list of all datasets, giving you the necessary slug for...
List Markers
Shows existing timeline annotations (markers) that have already been placed on a...
List Queries
Retrieves saved or defined query specifications for a single dataset, helping you...
List Triggers
Lists any active alerts (triggers) that have been set up and are monitoring the health of a specific dataset.
Security and governance baked right in.
Pick your AI client below to get set up. Just create a Vinkius account, subscribe, and you're instantly up and running. We handle the entire backend infrastructure, delivering out-of-the-box support for HTTPS Streamable, SSE, and OAuth2—zero messy routing required.
Claude AI
Open Claude Settings
Go to claude.ai, click your profile icon, then navigate to Customize → Connectors.
Add Custom Connector
Click the "+" button and select Add custom connector. Paste your Vinkius endpoint URL:
https://edge.vinkius.com/[YOUR_TOKEN_HERE]/mcp
Replace [YOUR_TOKEN_HERE] with your token
from cloud.vinkius.com. For OAuth-protected servers, expand
Advanced settings to add credentials.
Start a conversation
Open a new chat. The Honeycomb integration is available immediately — no restart needed.
Choose How to Get Started
Build a custom MCP for your own tools, or connect a ready-made integration from our catalog.
Build Your Own
Turn any API into an MCP. Import a spec, define Agent Skills, or deploy with MCPFusion.
- Import from OpenAPI, Swagger, or YAML specs
- Create Agent Skills with progressive disclosure
- Deploy to edge with MCPFusion framework
- Built in DLP, auth, and compliance on each call
- Real time usage dashboard and cost metering
- Publish to catalog or keep private
Make Your AI Do More
Start with Honeycomb, then connect any of our 5,200+ other servers whenever your AI needs more. One click, no limits.
- Use this MCP plus 5,200+ others, all in one place
- Add new capabilities to your AI anytime you want
- Connections are secured and governed automatically
- Track usage and costs across all your servers
- Works with Claude, ChatGPT, Cursor, and more
- New servers added to the catalog weekly
Independent Platform Disclaimer: Vinkius is an independent platform and is not affiliated with, endorsed by, sponsored by, verified by, or otherwise authorized by Honeycomb. All third-party trademarks, logos, and brand names are the property of their respective owners. Their use on this website is strictly for informational purposes to identify service compatibility and interoperability.
VINKIUS INFRASTRUCTURE
Cloud Hosted
Managed infra
V8 Isolated
Sandboxed per request
Zero-Trust Proxy
No stored credentials
DLP Enforced
Policy on each call
GDPR Compliant
EU data residency
Token Compression
~60% cost reduction
Debugging a production service used to be clicking through endless dashboards. Solved with Vinkius AI Gateway
Remember days of incident response? You’d jump between Grafana, your database console, and the log viewer. You'd have to manually filter by time range, then copy specific metric names into a second tool just to see if they correlated correctly. It was a mess of tabs, filters, and mental note-taking.
Now, you talk to your agent. You simply explain what broke—'Show me the performance metrics for payments from 2:00 PM to 2:15 PM.' The MCP handles listing the correct datasets, defining the query structure, running it, and giving you the actionable results you need, all without leaving the chat.
Honeycomb MCP delivers full data context and control.
You no longer have to rely on guesswork. You can ask the agent to list every available column using `list_dataset_columns`, confirming that all necessary fields (like transaction IDs or user types) are actually being tracked. This eliminates hours of 'where is this data' searching.
What’s different now is that observability isn't a destination—it's an active conversation. You get the answers you need, instantly contextualized on your timeline using `create_marker`.
What your AI can actually do with this
This connector lets you treat your telemetry data like a chat interface. Instead of building out complicated query languages or clicking through dozens of dashboards, you just talk to it. Your agent handles the heavy lifting, letting you run deep performance analysis on high-cardinality event sources right from your client.
You can ask to list all available datasets and immediately check their metadata. Need to know what fields a dataset tracks? Just ask for its schema. If something breaks, instead of manually building a query, you tell the system what you need, execute it, and get granular results fast. Plus, you can automatically annotate your timelines—saying 'Deployment v2.4 started'—so everyone sees exactly when key events happened.
It’s like having a dedicated SRE sitting next to you, ready to run any check on demand. This makes complex observability data accessible through the Vinkius catalog.
019d75b2-7ff0-721d-b7fc-c0d4016b3891 Here's how it actually works
The bottom line is: you get to interact with complex observability data using simple conversation instead of writing code.
Subscribe to this MCP and provide your Honeycomb API key and preferred region (US or EU).
Tell your AI client what data you need—for example, 'Show me the schema for the payment-gateway dataset.'
The agent executes the necessary action, giving you results like query IDs or structured metadata that you can then review.
Who is this actually for?
This MCP is for engineers and platform leads who spend too much time navigating dashboards, copy-pasting query language, or manually correlating event timelines during a high-stress incident.
You use the agent to instantly run complex queries and create markers on all datasets when an outage hits, keeping stakeholders informed without leaving your chat window.
After a new deployment, you inspect specific dataset trends by asking for schema insights or running targeted queries to check performance metrics immediately.
You use the tool to maintain an overview of which datasets are being used and who has access to shared boards across the organization.
What Changes When You Connect
Stop building complex query language DSLs for quick checks. You simply ask the agent to run a query, and it handles the structure needed.
You get immediate visibility into your data's shape by running list_dataset_columns, so you know exactly which fields are available before writing any queries.
During an incident, use the create_marker tool to instantly annotate the timeline for deployments or outages, making the root cause visible at a glance for every teammate.
The agent handles the multi-step process of data analysis. You can ask it to find datasets using list_datasets, and then inspect their schema without switching tabs.
You don't have to manually correlate event timelines anymore. The ability to create markers on all datasets means your entire team sees a consistent view of system history.
See it in action
Investigating a sudden performance drop
The agent runs the following sequence: first, it uses list_datasets to confirm the correct event source. Then, it asks for schema insights on that dataset using list_dataset_columns. Finally, it executes a targeted query via run_query to pinpoint exactly when the drop started and what metrics were affected.
Documenting an operational change
A platform lead needs to log that v3.1 was deployed across all services. They tell their agent, 'Create a marker on all datasets: Deploy v3.1 completed.' The agent uses create_marker and updates the shared timeline immediately for everyone.
Reviewing team access and usage
A manager asks, 'What boards are available to us?' The agent calls list_honeycomb_boards, giving them a clear list of shared dashboards. They can also use get_team_details to confirm who has access.
Verifying data completeness for audit
An engineer needs to know if the payment gateway dataset is complete. They first call list_dataset_columns to verify all required fields exist, and then use a query via run_query to check for records in the last 24 hours.
The honest tradeoffs
What to watch out for, and the recommended way to handle each one.
Treating it like a simple search engine
Trying to ask, 'What happened yesterday?' and expecting a full results table. This only gives general metadata.
To get actual data, you must first use list_datasets to find the specific event source slug. Then, define your time window and metrics when running create_query_specification, followed by run_query.
Ignoring dataset scope
Running a query against a general tag without specifying the exact dataset name (slug). This will fail because observability data is siloed.
Always start by calling list_datasets. Once you have the correct slug, use it when defining your query via create_query_specification.
Assuming real-time results
Running a complex query and expecting the data instantly. Large datasets take time to process.
After calling run_query, you will receive a result ID. You must then use get_query_result later to poll for and retrieve the final data.
When It Fits, When It Doesn't
Use this MCP if your primary pain point is translating complex, multi-step observability analysis into natural language requests. This tool shines when you need to perform sequential operations—like listing datasets, checking a schema, and then running a query on that specific dataset's columns. Don't use it if you are simply looking for basic API key management or general cloud service monitoring; those tasks require simpler integrations. If your goal is purely to generate alerts based on simple thresholds without complex data lookups, an alert-only tool might suffice. But because this MCP covers everything from schema inspection (list_dataset_columns) to timeline annotation (create_marker), it's the single most powerful connector for deep, conversational observability work.
Questions you might have
How do I find my Honeycomb API Key? +
Log in to Honeycomb, go to Team Settings, and navigate to the API Keys section. You will be able to generate and copy your Team API Key from there. Ensure you also note your account's region.
Which region should I select? +
If your browser URL starts with ui.eu1.honeycomb.io, select EU. Otherwise, select US. Using the correct region is required for the integration to connect to the right API cluster.
Can I run a query and get the data back? +
Yes! Use the run_query tool with a valid query ID. It will return a result ID, which you can then pass to the get_query_result tool once the analysis is complete.
Is the integration secure for telemetry data? +
Absolutely. The integration uses official Honeycomb Team API keys over HTTPS. Your credentials and queried data are encrypted and stored securely within the Vinkius Cloud infrastructure.