Klipfolio MCP. Get real-time metrics from any dashboard.
 Gemini
 Works with every AI agent you already use
…and any MCP-compatible client
Just plug in your AI agents and start using Vinkius.
Klipfolio MCP connects your AI client directly to a full suite of business analytics dashboards. It lets you manage, check, and monitor real-time Key Performance Indicators (KPIs) and data source health using natural conversation.
You can list entire dashboard setups or drill down into specific widget configurations without ever opening the Klipfolio app.
What your AI agents can do
Get dashboard details
Retrieves the complete setup information for a single, specific Klipfolio dashboard.
List account clients
Lists all sub-client accounts connected to your main Klipfolio instance.
List dashboards
Returns a list of every available dashboard by name and ID within the account.
Get a full inventory of every dashboard in the account so you know where to look.
Retrieve detailed information about any single dashboard, including its components and widgets (Klips).
List all the systems feeding data into Klipfolio and verify their current refresh status.
Force an immediate refresh on any specified data source to ensure metrics are current.
Look at the underlying data and configuration for specific metric panels (Klips) within a dashboard.
Ask AI about this MCP
Supported MCP Clients
OAuth 2.0 Compatible Gemini Waiting for input…
Klipfolio: 6 Tools Available
These tools allow your agent to manage the full lifecycle of analytics dashboards—from listing all available accounts to triggering data refreshes.
Make your AI actually useful.
Add this MCP to Claude, Cursor, or Windsurf and your AI stops guessing. It gets real tools to look things up, take action, and handle the stuff you keep doing by hand.
Start using Klipfolio on Vinkius019dd113get dashboard details
Retrieves the complete setup information for a single, specific Klipfolio dashboard.
019dd113list account clients
Lists all sub-client accounts connected to your main Klipfolio instance.
019dd113list dashboards
Returns a list of every available dashboard by name and ID within the account.
019dd113list data sources
Gets an inventory of all connected data sources, noting their last refresh time.
019dd113list individual klips
Lists and provides details for every individual widget (Klip) on a dashboard.
019dd113refresh data source
Manually triggers the data refresh process for a specified, connected source.
Choose How to Get Started
Build a custom MCP for your own tools, or connect a ready-made integration from our catalog.
Build Your Own
Turn any API into an MCP. Import a spec, define Agent Skills, or deploy with MCPFusion.
- Import from OpenAPI, Swagger, or YAML specs
- Create Agent Skills with progressive disclosure
- Deploy to edge with MCPFusion framework
- Built in DLP, auth, and compliance on every call
- Real time usage dashboard and cost metering
- Publish to catalog or keep private
Make Your AI Do More
Start with Klipfolio, then connect any of our 4,900+ other servers whenever your AI needs more. One click, no limits.
- Use this MCP plus 4,900+ others, all in one place
- Add new capabilities to your AI anytime you want
- Every connection is secured and compliant automatically
- Track usage and costs across all your servers
- Works with Claude, ChatGPT, Cursor, and more
- New servers added to the catalog every week
Independent Platform Disclaimer: Vinkius is an independent platform and is not affiliated with, endorsed by, sponsored by, verified by, or otherwise authorized by Klipfolio. All third-party trademarks, logos, and brand names are the property of their respective owners. Their use on this website is strictly for informational purposes to identify service compatibility and interoperability.
VINKIUS INFRASTRUCTURE
Cloud Hosted
Managed infra
V8 Isolated
Sandboxed per request
Zero-Trust Proxy
No stored credentials
DLP Enforced
Policy on every call
GDPR Compliant
EU data residency
Token Compression
~60% cost reduction
Works with Claude, ChatGPT, Cursor, and more
The Model Context Protocol standardizes how applications expose capabilities to LLMs. Instead of operating in isolation, your AI gains direct access to external platforms, live data, and real-world actions through secure, standardized connections.
This server provides 6 capabilities that interface natively with Claude, ChatGPT, Cursor, and any MCP client. No middleware. No custom integration required.
The manual process of checking business metrics is a pain point.
Today, getting an update on key performance indicators means logging into Klipfolio. You navigate to the correct dashboard, scroll through widgets, and manually check refresh timestamps for every data source feeding those numbers. If you need to check five different dashboards across three client accounts, that’s a minimum of ten clicks and twenty minutes.
With this MCP, your agent does it in seconds. Instead of clicking, you simply ask: 'Show me the latest KPIs.' The agent pulls the live data from the background sources, giving you an immediate status report without opening the dashboard interface.
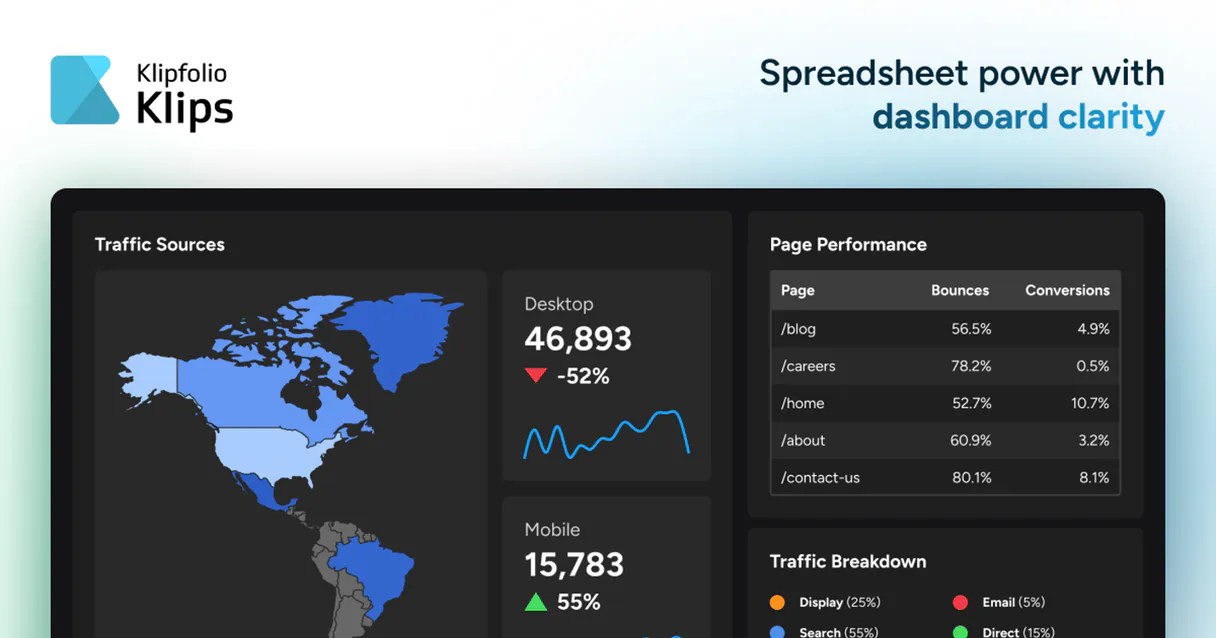
Klipfolio MCP lets you manage dashboards via conversation.
Manual checks for data health require logging into a separate source management area to list connections and check refresh times. You'll find yourself copy-pasting status reports back into Slack or Jira just to track who owns the stale credentials.
Now, you use this MCP to manage everything. Need to validate if Salesforce is connected? Ask your agent; it uses `list_data_sources` and tells you instantly. It’s about having a single source of truth for both data status and performance metrics.
What you can do with this MCP connector
This MCP gives your agent direct access to your company's live analytics environment. Instead of navigating multiple dashboards, you talk to it. Your AI client pulls data from hundreds of sources—like Google Analytics, Stripe, and HubSpot—and presents key metrics instantly. You can ask for the current MRR or check if a specific marketing campaign is performing well.
It monitors everything from user growth rates to cost-per-acquisition. If data falls out of sync, you can even trigger an automatic refresh on the source side. Because this MCP sits on Vinkius, your agent connects once and gains access to powerful analytics tools alongside whatever else your team needs.
019dd113-8ec6-735e-820d-8b7898b1e3e8 How Klipfolio MCP Works
- 1 Subscribe to this MCP on Vinkius and provide your Klipfolio API key.
- 2 Tell your AI client what you need. For example, 'Show me all dashboards' or 'What is the refresh status of Stripe?'
- 3 The agent executes the necessary calls against the platform and returns structured data detailing the requested metrics or resource lists.
The bottom line is: your AI client handles the API calls; you just talk to it.
Who Is Klipfolio MCP For?
This MCP is for technical analysts, product managers, and marketing ops specialists who spend too much time clicking through dashboard menus. If you need fast, accurate metrics without opening a browser, this is for you.
You use it to check data source health across the board and confirm if any KPIs are stale before building a report.
You ask for specific dashboard details on user adoption or feature usage metrics without needing to open the main analytics app.
You monitor campaign performance by checking key widgets (Klips) and running manual refreshes when data seems old.
What Changes When You Connect
- Always know data freshness. If you suspect a KPI is outdated, use the
list_data_sourcestool to check refresh times or runrefresh_data_sourceimmediately. - Avoid clicking through dashboards. You can ask your agent for specific details using
get_dashboard_details, getting instant context without opening the platform. - See everything at once. Use
list_dashboardsto get an immediate inventory of every dashboard, helping you locate metrics fast. - Drill down deep. Need to know what feeds a metric? Check the data structure by calling
list_individual_klipsfor widget specifics. - Manage multiple accounts easily. If your company has sub-clients, use
list_account_clientsfirst so you can scope your queries correctly.
Real-World Use Cases
The daily KPI check
A Product Manager needs to know the latest churn rate and MRR. They ask their agent, 'What are the current KPIs for the Executive Dashboard?' The agent uses get_dashboard_details and reports the figures immediately, saving a five-minute manual dashboard navigation.
Troubleshooting stale data
The Marketing team notices campaign metrics look off. They ask their agent to 'Check if Stripe or Google Analytics need refreshing.' The agent uses list_data_sources and, finding a stale source, calls refresh_data_source automatically.
Auditing dashboard scope
An analyst needs to confirm which client's metrics they are viewing. They run 'List all connected accounts.' The agent uses list_account_clients, ensuring the data pull is scoped correctly before listing dashboards.
Building a new report widget
A developer needs to know exactly how a dashboard metric was calculated. They ask the agent to 'Show me the details for the Conversion Rate Klip.' The agent uses list_individual_klips to pull the exact configuration.
The Tradeoffs
Assuming data is fresh
Running a report and seeing old numbers because you forgot to check the source status. You waste time troubleshooting bad metrics.
→
Always start by checking connectivity. Use list_data_sources first, then if necessary, run refresh_data_source before asking for any dashboard details.
Calling every single listing tool sequentially
Making separate calls to list clients, list dashboards, and list sources without a clear goal. This creates excessive overhead.
→
First, scope your view by running list_account_clients. Then, narrow the focus by using list_dashboards on that client ID before requesting details.
Confusing dashboard list with widget list
Asking for 'all widgets' when you really need to know which dashboards exist. This yields a massive, unreadable dump of metrics.
→
To start broad, use list_dashboards. To narrow down, then call get_dashboard_details or specifically request individual components using list_individual_klips.
When It Fits, When It Doesn't
Use this MCP if you need to query metrics, check data source health, or audit the structure of your Klipfolio dashboards through natural conversation. You're optimizing for read access and data integrity. Don't use it if your goal is to build a brand new dashboard from scratch—that requires manual input into the platform itself. If you just need raw API data dumps outside the context of a visual dashboard, an alternative direct API connector might be better suited.
Remember: listing tools (list_dashboards, list_data_sources) are for discovery; detail tools (get_dashboard_details, list_individual_klips) are for inspection. Always remember to run refresh_data_source if your data feels old.
Common Questions About Klipfolio MCP
How do I use the list_dashboards tool in Klipfolio? +
You prompt your agent to 'List all dashboards.' The agent calls list_dashboards, which returns an inventory of every available dashboard, giving you their names and IDs. This is your starting point for any deep dive.
Can I check data source health with the list_data_sources tool? +
Yes. The agent uses list_data_sources to give you an inventory of all connected sources and their last refresh time, letting you see exactly what's fresh and what might be stale.
What if the data is old? Should I use refresh_data_source? +
If list_data_sources shows a source that hasn't updated in hours, you should ask your agent to run refresh_data_source. This forces an immediate data pull and updates your metrics.
Does get_dashboard_details give me everything about a dashboard? +
It gives you the full setup details for one specific dashboard. It’s designed to show the overall context, including what widgets (Klips) are present and how they relate to the data sources.
What does running `list_individual_klips` allow me to do? +
It retrieves a full list of all individual Klip widgets used across your account. This lets you examine each widget's configuration and the specific data it displays, helping you find exact metrics without knowing which dashboard holds them.
How do I use `list_account_clients` to check my setup? +
This tool lists all sub-clients associated with your main Klipfolio account. You can see how many teams or departments are connected, which is useful for managing multi-tenant dashboards and permissions.
If I use `list_dashboards` frequently, will there be rate limits? +
Yes, the API enforces standard usage limits to ensure system stability. If you hit a throttle error, wait 60 seconds or adjust your workflow to make fewer, larger requests instead of many small ones.
What permissions are required for `list_data_sources`? +
You must use an API Key that has read-only access to data source instances. If the tool fails, check your key's expiration date and confirm it covers all the environments you intend to monitor.
Use it with your favorite AI tools
Connect this server to Cursor, Claude, VS Code, and more.