
New Relic AI (LLM Observability) MCP, Ready to Go
Monitor LLM costs and latency with the New Relic AI MCP. Connect to Claude or Cursor to get real-time AI observability and token tracking.
No credit card required. Experience the power of this integration risk-free.
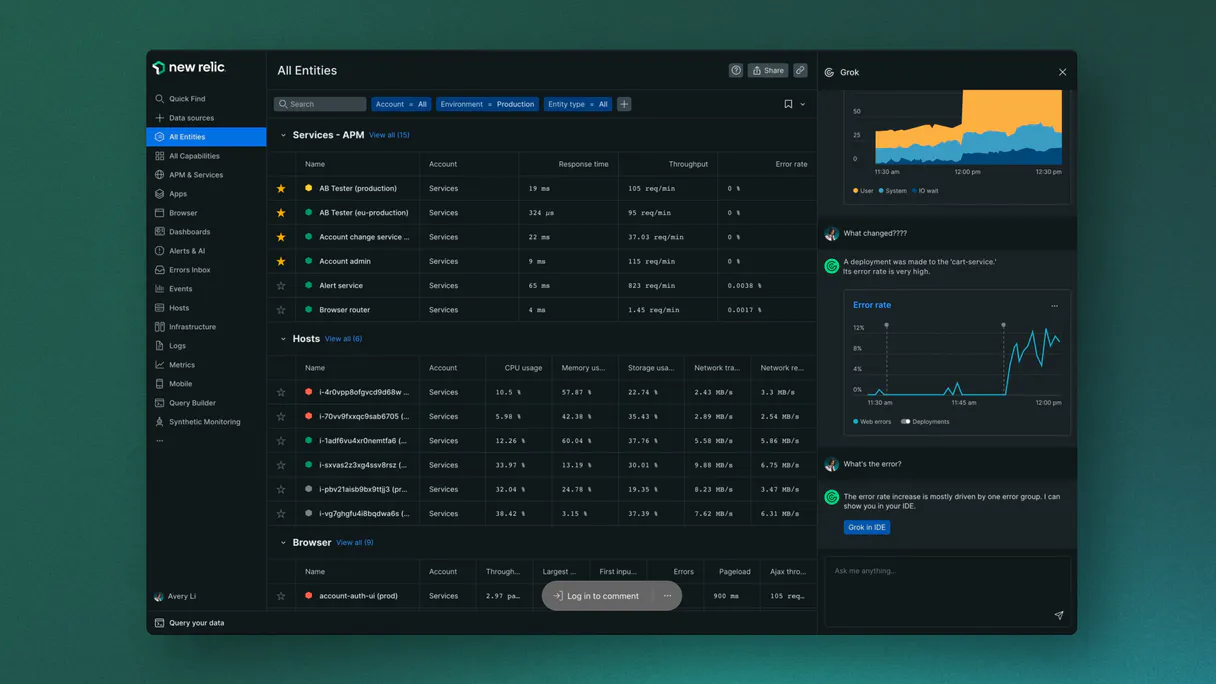
Monitor LLM token costs and p95 latency metrics in real time.
Works with every AI agent you already use
…and any MCP-compatible client









How fast is the New Relic AI (LLM Observability) Connector?
Average time for the server to become ready for requests over the last 14 days, measured until the initialize / tools/list handshake completes. Metrics are updated daily between 00:00 and 04:00 UTC. Create a free account, use this Connector on Vinkius Cloud, and connect it to your AI agent in seconds.
Waiting for input…
What AI agents can do with New Relic AI 10-Tool LLM Observability
Use these tools to query costs, check latency, and audit your AI telemetry directly from your agent.
List alert policies
Inspect internal arrays that handle specific Plan Math. This helps you see what's mitigating specific logic issues.
List apm apps
Run automated validation checks for explicit Gateway history. It helps you verify the routing of your history.
Custom nrql
Execute read-only queries to extract rich Churn flags from your data. Use this for deep, custom data analysis.
List dashboards
Identify active arrays spanning native Gateway auth. It helps you see which dashboards are currently active.
Query llm errors
Identify active arrays spanning native Hold parsing for error tracking. Use this to find specific failures.
Query llm costs
Extract properties that drive active Account logic for cost tracking. This shows you exactly where the money goes.
Query llm events
Identify bounded CRM records inside the Headless New Relic Platform. This helps you see specific event records.
Query llm feedback
Retrieve Cloud logging tracing for explicit Vault limits and human ratings. This pulls in your supervisor scores.
Query llm latency
Provision a JSON Payload for hard Customer bindings and latency data. Use this to see p95 response times.
Post custom event
Insert CustomAITelemetry rows to track internal agent states and billing rules. This helps you log custom markers.
A Connector is a URL. Vinkius runs it: hosting, security, governance, observability.
You're looking at one of 5,800+ managed Connectors. The real value isn't the catalog. It's the control plane that secures, governs, audits, and manages every interaction between your agents and the tools they use.
No Shadow AI
Every agent action is visible, approved, and auditable. Nothing runs outside your governance.
Absolute agent control
Fine-grained permissions for every agent, MCP, and tool. Instantly revoke access and audit every execution.
Cost control per token
Spend broken down to the token, tool, and agent. Budgets and hard limits. No surprise invoices.
Managed & monitored infra
We operate the runtime, authentication, scaling, retries, and monitoring. Your team manages AI, not infrastructure.
Data protection, DLP by design
Sensitive data is filtered before reaching the model. Access is governed so agents receive only the information they're allowed to use.
Token optimization, real savings
Lower AI costs by delivering the right context instead of unnecessary tools. Better accuracy, faster responses, and fewer wasted tokens.
New Relic AI LLM Observability for Tracking Token Costs
This is for the AI engineer who's tired of hunting through Grafana or New Relic dashboards at 2am just to see why a prompt is failing or why the bill is so high.
AI Engineer
Checks model accuracy and prompt performance during a Tuesday sprint without manual dashboard navigation.
Observability Lead
Monitors global token costs and p95 latency benchmarks to optimize the company's infrastructure spend.
DevOps Engineer
Audits APM app health and verifies alert policy triggers across multiple AI environments.
Frequently Asked Questions
Can the New Relic AI MCP help me see how much my AI agents are costing me? +
Yes, it pulls your token consumption data directly so you can see the exact USD cost across your entire infrastructure.
How do I check if my LLM responses are getting faster with the New Relic AI MCP? +
You can ask your agent to pull p95 latency and average response times to see real-time performance trends.
Can I use the New Relic AI MCP to see what my human supervisors think of the AI? +
It retrieves chronological feedback messages and 1-5 rating scores dumped by your human supervisors.
Does the New Relic AI MCP let me run complex queries on my data? +
Yes, it allows you to run custom NRQL queries to extract specific insights from your multi-tenant AI datasets.
Can I use the New Relic AI MCP to track custom internal states? +
You can post custom telemetry rows to track internal agent states and behavioral markers across your pipeline.
Is the New Relic AI MCP safe for my data? +
It connects to your existing New Relic account and follows your established security and permissions.
Can I check my total AI token costs through my agent? +
Yes. Use the query_llm_costs tool. Your agent will execute a NRQL aggregation summing the tokenSpanCost property from your LLM events over the last 24 hours, faceted by model, to provide a clear financial breakdown.
How do I monitor the p95 latency of my LLM generations? +
The query_llm_latency tool retrieves the average duration and latency matrices for your AI providers. Your agent will report the results as a timesheet or summary, helping you identify performance bottlenecks instantly.
Can my agent run custom NRQL queries against my telemetry data? +
Absolutely. Use the custom_nrql tool to provide any valid read-only NRQL string. Your agent will query New Relic's NerdGraph API and return the resulting dataset, allowing for complete flexibility in how you analyze your AI operations.
Your AI, connected to everything.








No credit card required · Free tier available











Other Connectors in this category
Gitpod Connector
Automate cloud development environments. Create, start, and manage Gitpod workspaces and organizations directly from any AI agent.
Neon (Serverless PostgreSQL) Connector
Manage serverless database infrastructure via Neon. Spawn zero-copy branches, audit projects, and monitor compute endpoints.
Resend Connector
Send emails and manage domains via Resend. Send transactional emails, track deliveries, manage domains and API keys from any AI agent.
Related Connectors
EIA Petroleum — Oil Market Intelligence Connector
Real-time oil market data: WTI and Brent crude prices, gasoline and diesel retail prices, U.S. production, refinery operations, Strategic Petroleum Reserve levels, crude imports by country, and the weekly petroleum status report.
Gitee Connector
Collaborative code hosting and development platform. Manage repositories, issues, and pull requests via AI.
Circadian REM Sleep Cycle Optimizer Connector
Harmonize your workflow with biological data. Calculate optimal wake-up times and bedtimes respecting 90-minute REM sleep phases for peak chronotype management.