TestMu AI MCP. Audit Builds and Debug Sessions via Conversation
TestMu AI manages cross-browser testing data by letting your agent talk directly to your test automation builds. You can list build runs, check specific browser sessions, and pull deep debugging artifacts like video recordings, screenshots, console errors, or precise command logs—all through natural conversation. It gives you full control over complicated CI/CD quality assurance without ever leaving your chat window.
Give Claude and any AI agent real-world access
Lists every test automation build and provides high-level telemetry for Selenium, Playwright, or Cypress suites.
Deep dives into a single browser run to extract console errors, network data, and metadata needed for debugging specific UI failures.
Retrieves absolute URLs for bug screenshots or full video recordings of any test execution.
Extracts precise, command-level logs from the testing framework, including W3C WebDriver protocols and timestamps.
Queries the grid to list exactly which combinations of macOS, Windows, iOS, and Android versions are available for testing.
Ask an AI about this
Waiting for input…
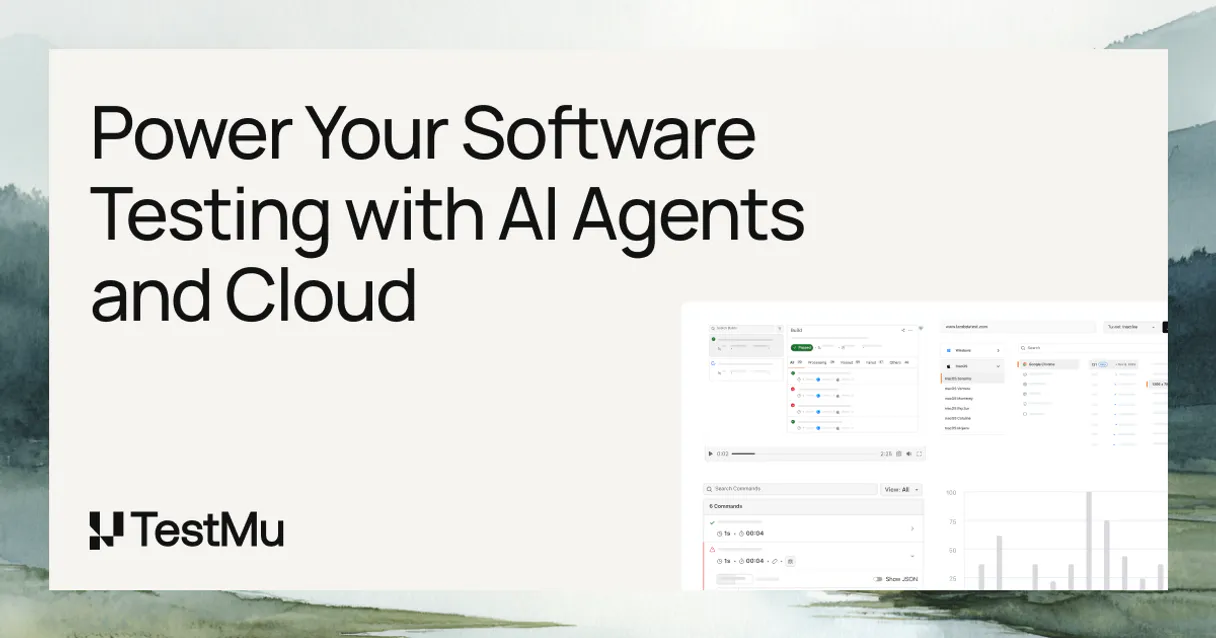
What AI agents can do with TestMu AI (formerly LambdaTest) with 10 Tools
These tools let your agent access the full spectrum of automated testing data, from high-level build summaries to individual command logs.
Make your AI actually useful.
Add this MCP to Claude, Cursor, or Windsurf and your AI stops guessing. It gets real tools to look things up, take action, and handle the stuff you keep doing by hand.
Start using TestMu AI (formerly LambdaTest) MCPList Builds
Lists all completed automated test builds, grouping thousands of Selenium, Cypress, Playwright, or Appium tests into parent CI/CD build...
Get Build
Retrieves detailed telemetry for a specific test automation build run.
List Sessions
Lists recent automated test sessions, providing the operating system, browser...
Get Session
Gets deep context for a specific test session by identifying console errors, network...
Get Session Logs
Extracts precise command logs from the Selenium or Appium framework for a selected...
Get Screenshots
Fetches visual bug screenshots that were captured during a specific test session's failure hook.
Get Video
Retrieves the full video recording URL for any completed test execution.
List Tunnels
Lists all active secure Tunnels, useful for monitoring localhost testing...
List Platforms
Returns a complete list of every OS and browser combination that is currently...
Get Build Sessions
Extracts all explicit test sessions associated with a specific build run, allowing...
Security and governance baked right in.
Pick your AI client below to get set up. Just create a Vinkius account, subscribe, and you're instantly up and running. We handle the entire backend infrastructure, delivering out-of-the-box support for HTTPS Streamable, SSE, and OAuth2—zero messy routing required.
Claude AI
Open Claude Settings
Go to claude.ai, click your profile icon, then navigate to Customize → Connectors.
Add Custom Connector
Click the "+" button and select Add custom connector. Paste your Vinkius endpoint URL:
https://edge.vinkius.com/[YOUR_TOKEN_HERE]/mcp
Replace [YOUR_TOKEN_HERE] with your token
from cloud.vinkius.com. For OAuth-protected servers, expand
Advanced settings to add credentials.
Start a conversation
Open a new chat. The TestMu AI integration is available immediately — no restart needed.
Choose How to Get Started
Build a custom MCP for your own tools, or connect a ready-made integration from our catalog.
Build Your Own
Turn any API into an MCP. Import a spec, define Agent Skills, or deploy with MCPFusion.
- Import from OpenAPI, Swagger, or YAML specs
- Create Agent Skills with progressive disclosure
- Deploy to edge with MCPFusion framework
- Built in DLP, auth, and compliance on each call
- Real time usage dashboard and cost metering
- Publish to catalog or keep private
Make Your AI Do More
Start with TestMu AI (formerly LambdaTest), then connect any of our 5,200+ other servers whenever your AI needs more. One click, no limits.
- Use this MCP plus 5,200+ others, all in one place
- Add new capabilities to your AI anytime you want
- Connections are secured and governed automatically
- Track usage and costs across all your servers
- Works with Claude, ChatGPT, Cursor, and more
- New servers added to the catalog weekly
Independent Platform Disclaimer: Vinkius is an independent platform and is not affiliated with, endorsed by, sponsored by, verified by, or otherwise authorized by TestMu AI. All third-party trademarks, logos, and brand names are the property of their respective owners. Their use on this website is strictly for informational purposes to identify service compatibility and interoperability.
VINKIUS CLOUD
Cloud Hosted
Managed infra
V8 Isolated
Sandboxed per request
Zero-Trust Proxy
No stored credentials
DLP Enforced
Policy on each call
GDPR Compliant
EU data residency
Token Compression
~60% cost reduction
The Mess of Manual Debugging Artifact Collection
Right now, when a test fails, you open the dashboard. You copy the session ID. Then you switch to the logs tab and download the command log file. If it's a UI bug, you click 'Screenshot,' then you have to manually check network calls in another browser tab. It’s five different tabs and three hours of context switching.
With this MCP, your agent handles all that clicking for you. You simply ask your AI client to find the failure evidence. It pulls the screenshot, the full video link, the console error, and the command logs—all summarized in one natural response.
Getting All Test Artifacts with TestMu AI
The manual steps that vanish are the copy-pasting of session IDs across tools, downloading zip files just to check a single error line, and manually cross-referencing platform capabilities against your requirements document.
Now, you speak natural language. You get structured data back from `list_builds` or the precise technical details needed for debugging using `get_session`. The whole process becomes conversational.
What TestMu AI MCP does for your AI
Need to debug why a UI element failed on an old version of Safari? You don't have to jump between dashboards and log files anymore. This MCP connects your agent directly to TestMu AI, giving you immediate access to your entire cross-browser testing suite history. Instead of searching through complex UIs, you ask the questions—like 'Show me all build failures in staging' or 'Give me the full logs for session ABC.' Your agent handles the heavy lifting: it fetches everything from high-level aggregated telemetry on Selenium and Playwright builds to deep context within individual test sessions.
You can pull absolute URLs for bug screenshots, retrieve full video recordings of browser executions, and extract command-level logs with exact timestamps. This capability is hosted on Vinkius, making sure any MCP-compatible client you use—whether it's Claude or Cursor—can access this crucial testing data. It's all about bringing your entire quality assurance pipeline into a natural conversation.
019d75c3-e3ee-7276-aa86-11ef6528d979 How to set up TestMu AI MCP
The bottom line is: it turns complex, multi-tab debugging into a simple conversation with your AI client.
Subscribe to this MCP and enter your TestMu AI Username and Access Key.
Connect the service to your preferred agent (Claude, Cursor, etc.).
Tell your agent what you need—for example, 'Show me all build failures from last night'—and get the data returned instantly.
Who uses TestMu AI MCP
This MCP is essential for QA Automation Engineers and Software Developers who spend too much time clicking through dashboards just to debug a single flaky UI issue. If you're tired of manually gathering logs, screenshots, and build metrics from multiple tabs at 2 AM, this tool gives your agent the keys.
Monitors build health across different CI/CD pipelines and inspects diagnostic logs through natural conversation without leaving their IDE or dashboard.
Retrieves session screenshots, video recordings, and network data to debug UI failures directly from their development workspace for rapid iteration cycles.
Audits CI/CD test results across various environments and monitors secure tunnel connections efficiently to verify deployment readiness.
Benefits of connecting TestMu AI MCP
Stop switching tabs. Instead of jumping to a dashboard to see build status, ask your agent to list all test automation builds using the list_builds tool. You get the high-level overview immediately.
No more guessing why something broke. If you find an issue, use get_session to pull deep context on that specific failure, grabbing console errors and network details without leaving your chat window.
Instant visual proof: Need to show a bug? Use get_screenshots or get_video to fetch the absolute URL for the exact screenshot or video recording of the failure. It's instant evidence.
Mastering regressions is easier with get_build_sessions. If a build fails, you can ask your agent to pull all related test sessions so you know exactly which part of the test suite needs fixing.
Verify compatibility before writing code. Use list_platforms to confirm that Windows 11/Chrome or macOS Sonoma/Safari is actually available in the grid. You'll never be surprised by missing capabilities again.
TestMu AI MCP use cases
Diagnosing a Flaky Login Bug
A developer notices a login issue only on older Android versions. They ask their agent to check the platform support using list_platforms. Then, they use get_session on a failing session ID to get console errors and network configs, quickly pinpointing if it's an authentication timeout or a UI element failure.
Auditing Pre-Release Builds
A DevOps team member needs to verify the health of the latest release candidate. They ask their agent to list_builds and filter for 'Staging.' The agent returns aggregated telemetry, confirming that all critical Playwright suites passed before approval.
Tracking a Specific Regression
A QA engineer finds an unexpected failure in the staging environment. They use get_build_sessions tied to the build ID, narrowing down the issue to one specific session. Then they grab get_video and get_screenshots for that session to show their manager.
Checking Environment Scope
A team is planning a new feature requiring iOS 17 support. They ask the agent to check supported capabilities via list_platforms, confirming that the necessary OS/browser combination exists before committing development resources.
TestMu AI MCP tradeoffs
What to watch out for, and the recommended way to handle each one.
Treating it like a simple status check
Asking, 'Did the build pass?' and getting only a vague True/False answer that doesn't explain why or what failed.
Don't just ask for success. Ask your agent to get_build telemetry for the specific ID, focusing on the failure count and then asking it to find all associated sessions using get_build_sessions.
Only relying on screenshots
Getting a screenshot that shows an error but provides no underlying technical context (e.g., Was it network related or code related?).
Always pair the visual proof with logs. First, use get_screenshots, and then immediately follow up by asking for get_session to pull console errors and network data.
Forgetting platform scope
Writing code that passes on a local machine but fails in the CI/CD pipeline because it was testing against an outdated browser version.
Before starting, use list_platforms to confirm which OS and browser combinations are actively available. This prevents you from building tests for unsupported environments.
When to use TestMu AI MCP
Use this MCP when your debugging process involves gathering complex, multi-layered technical evidence—things like command logs, video recordings, or network artifacts. If the problem is 'the build failed,' this tool allows you to drill down using get_build and then use get_session_logs for the root cause. Don't use it if all you need is a simple list of active tunnels; that job is better suited for the dedicated list_tunnels function alone. Crucially, this MCP excels at taking data from disparate sources (screenshots, console errors, video) and presenting them in one conversation thread, which is something basic CI/CD dashboard integrations can't do.
Frequently asked questions about TestMu AI MCP
How do I use TestMu AI to check if a specific browser version is supported? +
Use the list_platforms tool. This function returns an exact matrix of all OS and browser versions currently available in the testing grid, so you know what environments your code will actually run on.
Can TestMu AI help me find command logs for a failed test? +
Yes. Use get_session_logs to extract precise Selenium or Appium command logs. This gives developers the low-level protocol data needed to understand exactly where the testing framework broke.
What is the difference between listing builds and getting build telemetry with TestMu AI? +
The list_builds tool shows you a list of all completed runs. The get_build tool takes one specific ID from that list and returns highly detailed metrics for that single run.
Does TestMu AI only provide screenshots, or can it give me videos? +
It provides both. You can use get_screenshots for immediate visual bugs, or you can use the get_video tool to retrieve a full video recording of the entire test execution.
If I have multiple builds, how do I check all sessions? +
First, run list_builds to identify the build you care about. Then, use get_build_sessions with that specific build ID to pull every single test session associated with it for review.