Airbrake MCP for AI. Correlate Code Changes with Live Failures
 Gemini
 Works with every AI agent you already use
…and any MCP-compatible client
How this MCP server connects to your AI agent
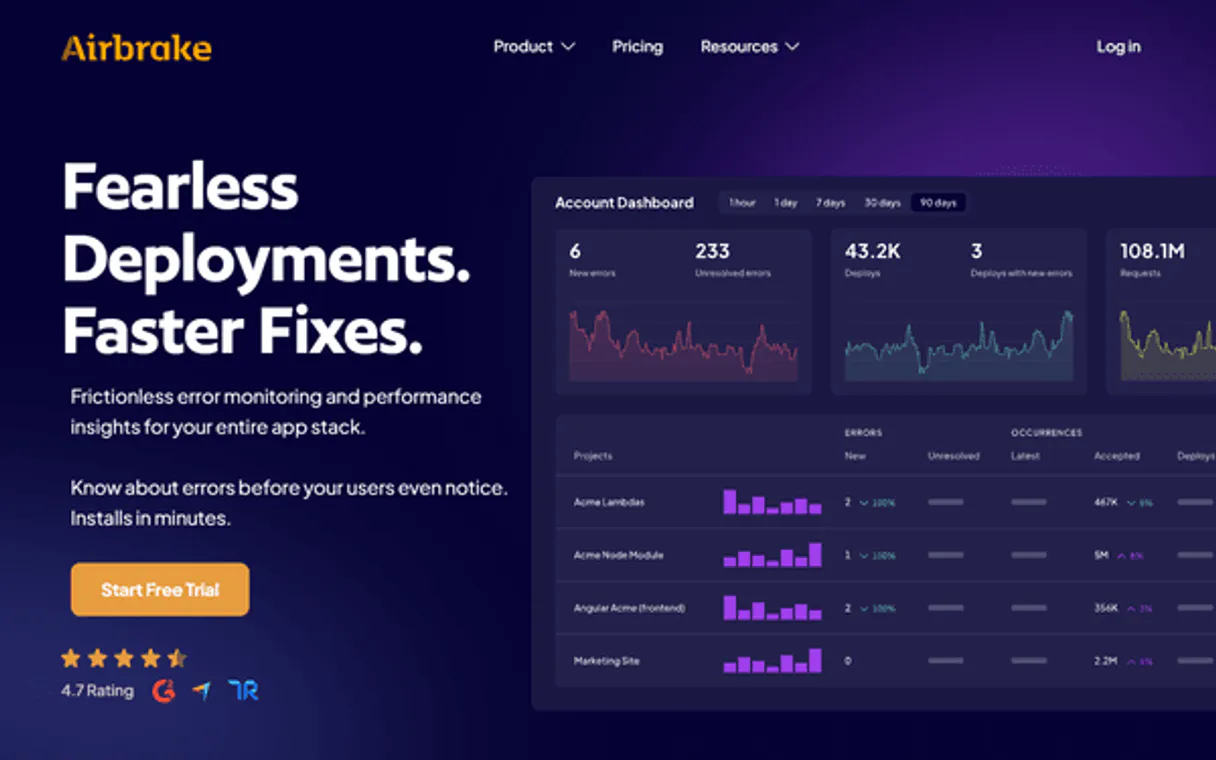
Airbrake MCP lets you manage your entire application error monitoring workflow through natural conversation. Instantly check system health, analyze complex stack traces across projects, and correlate specific code deployments directly within your AI client.
Stop jumping between dashboards; get real-time stability metrics right where you're coding.
What AI agents can do with Airbrake Automation
Check airbrake status
Verifies if the API connection is working and checks the current account status.
Get error group
Pulls up detailed information about a specific, recurring error pattern.
Get project
Fetches comprehensive details for one of your monitored code projects.
Verify API connectivity status instantly to confirm that error data is flowing correctly.
Get a list of all monitored codebases and retrieve detailed configuration settings for any specific project.
See grouped error patterns, listing counts and severity levels to pinpoint the most common issues across your system.
Inspect a specific error group using full stack traces and frequency data to understand exactly what went wrong.
List all historical deployments, or record a new release with its version number and environment details.
View every configured deployment environment, like staging or production, for cross-project comparison.
Ask an AI about this
Waiting for input…
What AI agents can do with Airbrake: 10 Tools for Monitoring System Health
Use these tools to list projects, check status, inspect detailed error clusters, manage deployment records, and monitor all system environments.
Make your AI actually useful.
Add this MCP to Claude, Cursor, or Windsurf and your AI stops guessing. It gets real tools to look things up, take action, and handle the stuff you keep doing by hand.
Start using Airbrake on VinkiusCheck Airbrake Status
Verifies if the API connection is working and checks the current account status.
Get Error Group
Pulls up detailed information about a specific, recurring error pattern.
Get Project
Fetches comprehensive details for one of your monitored code projects.
List Deploys
Retrieves a list of all tracked software deployments or releases.
List Environments
Shows all configured environments (like staging, development) set up for your...
List Error Groups
Lists all major error groups within a project, showing how many times they've occurred and when they were last seen.
List Notices
Retrieves individual records of specific error occurrences over time.
List Projects
Provides an inventory of every project currently being monitored by Airbrake.
Report Notice
Allows you to manually report a new, specific error notice for tracking purposes.
Track Deploy
Records a new software deployment version and the environment it was released into.
Security and governance baked right in.
Pick your AI client below to get set up. Just create a Vinkius account, subscribe, and you're instantly up and running. We handle the entire backend infrastructure, delivering out-of-the-box support for HTTPS Streamable, SSE, and OAuth2—zero messy routing required.
Claude AI
Open Claude Settings
Go to claude.ai, click your profile icon, then navigate to Customize → Connectors.
Add Custom Connector
Click the "+" button and select Add custom connector. Paste your Vinkius endpoint URL:
https://edge.vinkius.com/[YOUR_TOKEN_HERE]/mcp
Replace [YOUR_TOKEN_HERE] with your token
from cloud.vinkius.com. For OAuth-protected servers, expand
Advanced settings to add credentials.
Start a conversation
Open a new chat. The Airbrake integration is available immediately — no restart needed.
Choose How to Get Started
Build a custom MCP for your own tools, or connect a ready-made integration from our catalog.
Build Your Own
Turn any API into an MCP. Import a spec, define Agent Skills, or deploy with MCPFusion.
- Import from OpenAPI, Swagger, or YAML specs
- Create Agent Skills with progressive disclosure
- Deploy to edge with MCPFusion framework
- Built in DLP, auth, and compliance on every call
- Real time usage dashboard and cost metering
- Publish to catalog or keep private
Make Your AI Do More
Start with Airbrake, then connect any of our 5,100+ other servers whenever your AI needs more. One click, no limits.
- Use this MCP plus 5,100+ others, all in one place
- Add new capabilities to your AI anytime you want
- Every connection is secured and compliant automatically
- Track usage and costs across all your servers
- Works with Claude, ChatGPT, Cursor, and more
- New servers added to the catalog every week
Independent Platform Disclaimer: Vinkius is an independent platform and is not affiliated with, endorsed by, sponsored by, verified by, or otherwise authorized by Airbrake. All third-party trademarks, logos, and brand names are the property of their respective owners. Their use on this website is strictly for informational purposes to identify service compatibility and interoperability.
VINKIUS INFRASTRUCTURE
Cloud Hosted
Managed infra
V8 Isolated
Sandboxed per request
Zero-Trust Proxy
No stored credentials
DLP Enforced
Policy on every call
GDPR Compliant
EU data residency
Token Compression
~60% cost reduction
Built on the Model Context Protocol (MCP) for Claude, ChatGPT, Cursor, and more
The Model Context Protocol standardizes how applications expose capabilities to LLMs. Instead of operating in isolation, your AI gains direct access to external platforms, live data, and real-world actions through secure, standardized connections.
This connection provides 10 powerful capabilities that interface natively with Claude, ChatGPT, Cursor, and other compatible AI platforms. No middleware. No custom integration required.
Debugging means jumping between four different tools., Solved with Vinkius AI Gateway
Right now, finding out why a feature broke requires manual effort. You have to check the live dashboard for the initial spike; then you copy an error message into Jira; next, you open the deployment system to see what version was running; and finally, you jump into your code editor to find the source file. It's tedious, high-friction work that slows down every release.
With this MCP, all of that process collapses into a single conversation. You ask your agent about the bug, and it uses its tools to check `list_error_groups`, cross-reference versions using `list_deploys`, and even provides the stack trace from an error group inspection—all without you lifting a finger.
Airbrake MCP gives you actionable insight.
The manual steps that disappear include copying timestamps, manually cross-referencing project IDs across different services, and compiling disparate pieces of information into one summary report. You don't have to piece together the story; the agent does it for you.
Debugging isn't about gathering data anymore. It's about getting immediate answers that pinpoint the root cause and let you fix it fast.
What your AI can actually do with this
You don't need to keep switching tabs or context-switching just to debug a failure. This MCP connects your airbrake account to any compatible agent, letting you manage error tracking and deployment status using plain conversation. You can ask your AI client to check the overall health of your application, list all active projects, and pull up detailed reports on specific errors that popped up weeks ago.
Want to know if a recent code push caused a spike in timeouts? It handles that correlation for you. Need to manually log a new bug found during testing? You can report it right through the agent conversation. Because this MCP is hosted on Vinkius, your AI client gets access to all of Airbrake's monitoring tools from one place, making debugging faster and less painful.
019dd0b6-33bd-7342-ae1e-fa1a237f9560 Here's how it actually works
The bottom line is you get deep error monitoring and deployment tracking integrated directly into your development workflow.
Subscribe to this MCP and enter your API Key from your Airbrake account settings.
Connect your AI agent to the Vinkius catalog using your preferred client (Claude, Cursor, etc.).
Start asking conversational questions like, 'What were the top errors on our production environment last night?'
Who is this actually for?
This MCP is for engineers who are tired of context switching between code editors, dashboard UIs, and ticketing systems just to figure out a bug. It's for the DevOps specialist who needs visibility into production stability or the QA engineer who has to manually check error logs across multiple environments.
Uses this MCP to investigate complex stack traces and confirm if an error spike relates to a recent feature push, without ever leaving their IDE.
Manages release tracking by listing all deployments and correlating those version changes with observed error group counts across different environments.
Monitors error groups across staging and production, and uses the ability to report new notices when they find custom failures during testing cycles.
What Changes When You Connect
Cut down debugging time dramatically. Instead of navigating complex web dashboards, your agent lets you list error groups and instantly get a summary of the top 3 issues.
Track deployments accurately. Use the track_deploy tool to record every release version, allowing your AI client to connect current errors directly back to the faulty install.
Understand failure scope by checking environments. The list_environments capability lets you see if a bug is isolated to staging or if it’s hitting production too.
Get deep insight into bugs using get_error_group. You can inspect full stack traces and frequency data without leaving your coding environment, which saves massive time.
Maintain system integrity by listing all projects. Use the list_projects tool to quickly verify that every service you manage is connected and monitored.
See it in action
Investigating a Sudden Performance Drop
A QA tester notices slow response times in production. They ask their agent, 'What were the top errors on the API Gateway project?' The agent uses list_error_groups and reports that connection timeouts spiked right after the last recorded release (verified via list_deploys), pointing them immediately to the faulty code area.
Debugging a Staging Environment Bug
A developer finds an intermittent bug in staging. They ask their agent to inspect the error group details using get_error_group. The agent provides the full stack trace and affected users, allowing the developer to replicate and fix the issue immediately.
Mandatory Bug Reporting
A support engineer finds a unique client-side error. Instead of submitting a ticket with limited data, they ask their agent to report it using report_notice, providing structured data that helps the development team pinpoint the exact cause.
Verifying System Readiness
A DevOps engineer needs to check if all services are ready for a major release. They use the agent to run a health check (check_airbrake_status) and then call list_environments to confirm that both staging and production are fully configured before starting deployment.
The honest tradeoffs
Manually cross-referencing logs
A developer sees a bug in the dashboard, then has to open Jira to check project status, and finally opens Git to find the relevant deployment tag. This takes 15 minutes of context switching.
Ask your agent to perform all these steps conversationally. First, use list_projects to identify the scope. Then, ask it to correlate errors with releases by using list_deploys, getting you a single answer that links the bug to the specific version.
Ignoring error history
Only looking at current dashboard metrics without knowing if this is a new spike or an old, persistent issue. This leads to misprioritizing fixes.
Always ask your agent to list historical notices using list_notices. This gives context and shows whether the problem has been seen before, which helps with prioritization.
Assuming all environments are active
A team assumes 'testing' means they can look at it, but forgot to verify if a specific project had an environment configured for that stage.
Before troubleshooting, always use list_environments on the target project. This confirms exactly which deployment stages (dev, staging, etc.) are visible and monitored by Airbrake.
When It Fits, When It Doesn't
Use this MCP if your core problem is correlating system failures with code deployments or needing immediate access to deep error stack traces across multiple services. You need a single point of truth for stability data.
Don't use it if you just need to write general documentation, manage user accounts, or process non-technical business records (like invoicing). For those tasks, an HR or CRM MCP is better suited. If your only goal is to view simple metrics without the ability to drill down into stack traces using get_error_group, a simpler dashboard tool might suffice. But if you need the depth of visibility that comes from listing error notices and tracking deployments, this is mandatory.
Questions you might have
How do I use Airbrake MCP to see all my monitored applications? +
You simply ask your agent to list projects. The tool uses list_projects to give you a full inventory of every codebase and its monitoring status within the system.
Can I use Airbrake MCP to check if my API key is valid? +
Yes, run the airbrake_status tool. It verifies your API connectivity immediately, ensuring that all subsequent actions you request will work correctly.
What if a bug happens outside of business hours? Can Airbrake MCP help? +
Absolutely. You can use list_notices to retrieve individual error occurrences and see exactly when they happened, which is critical for understanding off-hours failures.
How does Airbrake MCP know what version of code caused the bug? +
You first need to use track_deploy to record a new release. This links the version number and environment to your error data, allowing you to correlate failures accurately.
Does Airbrake MCP only work for production issues? +
No. It allows you to list environments, so you can monitor staging or development projects just as easily to catch problems before they hit the live system.
We've already built the connector for Airbrake. Just plug in your AI agents and start using Vinkius.
No hosting. No infrastructure. No complex setup.
All 10 tools are live and waiting.
You're up and running in seconds.
Gemini Vinkius gives your AI agents access to the full catalog of app connectors, all fully managed, secure, and enterprise-ready. One subscription, every tool you need.
Built, hosted, and secured by Vinkius. You just connect and go.