GridStatus MCP Server for Claude Desktop 12 tools — connect in under 2 minutes
Claude Desktop is Anthropic's native application for interacting with Claude AI models on macOS and Windows. It was the first consumer application to ship with built-in MCP support, making it the reference implementation for the Model Context Protocol standard.
ASK AI ABOUT THIS MCP SERVER
Vinkius supports streamable HTTP and SSE.
Vinkius Desktop App
The modern way to manage MCP Servers — no config files, no terminal commands. Install GridStatus and 2,500+ MCP Servers from a single visual interface.


{
  "mcpServers": {
    "gridstatus": {
      // Your Vinkius token. get it at cloud.vinkius.com
      "url": "https://edge.vinkius.com/[YOUR_TOKEN_HERE]/mcp"
    }
  }
}
* Every MCP server runs on Vinkius-managed infrastructure inside AWS - a purpose-built runtime with per-request V8 isolates, Ed25519 signed audit chains, and sub-40ms cold starts optimized for native MCP execution. See our infrastructure
About GridStatus MCP Server
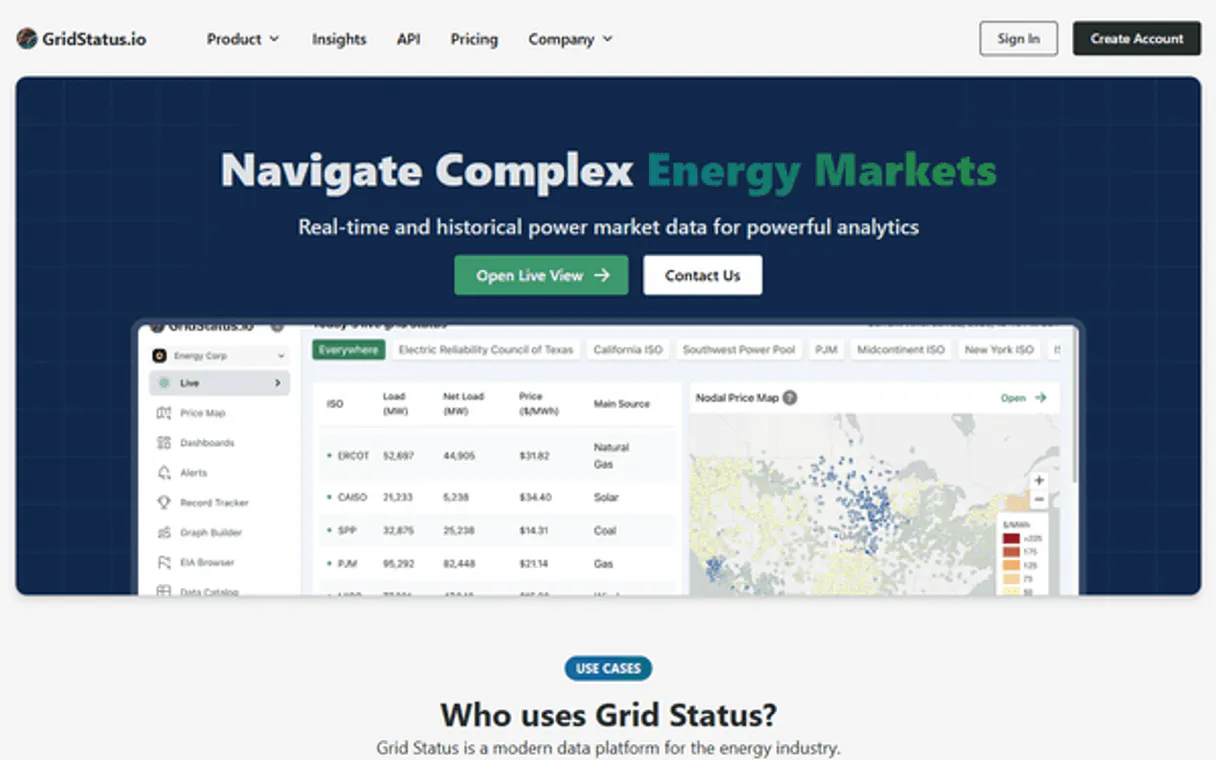
Connect to GridStatus.io API and bring comprehensive US electricity market intelligence to any AI agent. Monitor all major Independent System Operators (ISOs), track renewable energy transition, analyze wholesale prices, and understand grid dynamics across America.
Claude Desktop is the definitive way to connect GridStatus to your AI workflow. Add Vinkius Edge URL to your config, restart the app, and Claude immediately exposes all 12 tools in the chat interface. ask a question, Claude calls the right tool, and you see the answer. Zero code, zero context switching.
What you can do
- Electricity Load/Demand — Retrieve real-time and historical electricity consumption data (MW) for any US ISO region
- Fuel Mix & Generation — Get breakdown of power generation by source (coal, natural gas, nuclear, solar, wind, hydro) to understand the energy mix
- Day-Ahead LMP Pricing — Access hourly Locational Marginal Pricing forecasts for specific nodes and trading hubs across ISOs
- Real-Time 5-Minute LMP — Track live wholesale electricity prices at 5-minute intervals to identify price spikes and volatility
- ERCOT SPP Data — Query Settlement Point Prices for Texas grid including day-ahead hourly and real-time 15-minute intervals at trading hubs
- Standardized Zonal Data — Fetch consistently formatted hourly data with regional/zonal breakdowns for modeling and analysis
- Capacity Markets — Monitor capacity commitments and resource adequacy data for long-term planning
- Dataset Exploration — List all available datasets, check metadata including coverage dates and available columns
- API Usage Tracking — Monitor your API quota usage, row counts, and rate limits
- Custom Dataset Queries — Query any dataset with advanced filtering, resampling, and aggregation controls
- Multi-ISO Coverage — Access data from ERCOT (Texas), CAISO (California), PJM (Mid-Atlantic), MISO (Midwest), NYISO (New York), ISO-NE (New England), and SPP (Southwest)
The GridStatus MCP Server exposes 12 tools through the Vinkius. Connect it to Claude Desktop in under two minutes — no API keys to rotate, no infrastructure to provision, no vendor lock-in. Your configuration, your data, your control.
How to Connect GridStatus to Claude Desktop via MCP
Follow these steps to integrate the GridStatus MCP Server with Claude Desktop.
Open Claude Desktop Settings
Go to Settings → Developer → Edit Config to open claude_desktop_config.json
Add the MCP Server
Paste the configuration above into the mcpServers section
Restart Claude Desktop
Close and reopen Claude Desktop to load the new server
Start using GridStatus
Look for the 🔌 icon in the chat. your 12 tools are now available
Why Use Claude Desktop with the GridStatus MCP Server
Claude Desktop by Anthropic provides unique advantages when paired with GridStatus through the Model Context Protocol.
Claude Desktop is the reference MCP client. it was designed alongside the protocol itself, ensuring the most complete and stable MCP implementation available
Zero-code configuration: add a server URL to a JSON file and Claude instantly discovers and exposes all available tools in the chat interface
Claude's extended thinking capability lets it reason through multi-step tool usage, chaining multiple API calls to answer complex questions
Enterprise-grade security with local config storage. your tokens never leave your machine, and connections go directly to Vinkius Edge network
GridStatus + Claude Desktop Use Cases
Practical scenarios where Claude Desktop combined with the GridStatus MCP Server delivers measurable value.
Interactive data exploration: ask Claude to query DNS records, look up WHOIS data, and cross-reference results in a single conversation
Ad-hoc security audits: type a domain name and let Claude enumerate subdomains, check DNS history, and flag configuration anomalies. all through natural language
Executive briefings: generate comprehensive domain intelligence reports by asking Claude to compile findings into a formatted summary
Learning and training: new team members can explore API capabilities conversationally without needing to read documentation
GridStatus MCP Tools for Claude Desktop (12)
These 12 tools become available when you connect GridStatus to Claude Desktop via MCP:
get_api_usage
Shows how many rows you've queried and your remaining allowance. USE WHEN: - User asks about their API usage or quota - User wants to check how many rows they have remaining - User needs to verify their rate limits - User asks about their GridStatus account status EXAMPLES: - "How much API quota do I have left?" → call with no params - "Check my API usage this month" → call with no params - "Show my rate limits" → call with no params Get API usage statistics and rate limits for your GridStatus account
get_capacity_data
This data is used to track long-term resource adequacy and capacity commitments. USE WHEN: - User asks about generation capacity or capacity markets - User needs capacity commitment data for an ISO - User wants to track resource adequacy metrics - User asks about capacity prices or availability SUPPORTED ISOs: - pjm (primary capacity market), others may be available PARAMETERS: - iso (REQUIRED): ISO identifier - start (OPTIONAL): Start date - end (OPTIONAL): End date - limit (OPTIONAL): Maximum rows EXAMPLES: - "PJM capacity data for next month" → call with iso="pjm", start="2026-05-01" - "Show capacity commitments" → call with iso="pjm" Get capacity market data for a US ISO
get_dataset_metadata
USE WHEN: - User wants to know the date range covered by a dataset - User needs to see what columns are available in a dataset - User asks about data frequency or schema for a specific dataset - User is validating if a dataset exists before querying PARAMETERS: - dataset_id (REQUIRED): Dataset identifier (e.g. "pjm_load", "ercot_fuel_mix", "caiso_lmp_day_ahead_hourly") EXAMPLES: - "Show metadata for PJM load dataset" → call with dataset_id="pjm_load" - "What columns are in ERCOT fuel mix?" → call with dataset_id="ercot_fuel_mix" - "Date range for CAISO LMP" → call with dataset_id="caiso_lmp_day_ahead_hourly" Get metadata for a specific GridStatus dataset
get_fuel_mix
) for any supported US ISO. Essential for understanding where electricity comes from and tracking the renewable energy transition. USE WHEN: - User asks about the energy mix or generation breakdown - User wants to know how much power comes from solar, wind, coal, etc. - User asks about renewable energy percentage - User needs to compare fossil vs clean energy generation SUPPORTED ISOs WITH FUEL MIX: - ercot (Texas), caiso (California), isone (New England) PARAMETERS: - iso (REQUIRED): ISO identifier: ercot, caiso, or isone - start (OPTIONAL): Start date - end (OPTIONAL): End date - limit (OPTIONAL): Maximum rows - timezone (OPTIONAL): Timezone for results EXAMPLES: - "What is Texas energy mix right now?" → call with iso="ercot", start="latest" - "Show Californiaia renewable generation today" → call with iso="caiso", start="2026-04-07" - "New England fuel mix this week" → call with iso="isone", start="2026-04-01", limit=168 Get electricity generation by fuel source (energy mix) for a US ISO
get_lmp_data
LMP is measured in dollars per megawatt-hour ($/MWh). USE WHEN: - User asks about wholesale electricity prices at specific locations - User needs day-ahead price forecasts for an ISO - User wants to compare prices across different nodes - User asks about LMP or nodal pricing data SUPPORTED ISOs WITH LMP: - pjm (Mid-Atlantic), caiso (California), miso (Midwest), nyiso (New York), isone (New England), spp (Southwest) PARAMETERS: - iso (REQUIRED): ISO identifier: pjm, caiso, miso, nyiso, isone, or spp - start (OPTIONAL): Start date - end (OPTIONAL): End date - limit (OPTIONAL): Maximum rows - timezone (OPTIONAL): Timezone for results - filter_column (OPTIONAL): Column to filter on (e.g. "location") - filter_value (OPTIONAL): Value to filter by EXAMPLES: - "Show PJM day-ahead LMP for tomorrow" → call with iso="pjm", start="2026-04-08" - "CAISO LMP at SP15 node today" → call with iso="caiso", start="2026-04-07", filter_column="location", filter_value="SP15" - "MISO hourly prices this week" → call with iso="miso", start="2026-04-01", limit=168 Get day-ahead Locational Marginal Pricing (LMP) data for a US ISO
get_load_data
Shows how much electricity is being consumed across the grid region. USE WHEN: - User asks about electricity demand or consumption for an ISO - User needs load data for a specific time period - User wants to compare load across different regions - User asks how much electricity is being used in Texas, California, etc. SUPPORTED ISOs: - ercot (Texas), caiso (California), pjm (Mid-Atlantic), miso (Midwest) - nyiso (New York), isone (New England), spp (Southwest) PARAMETERS: - iso (REQUIRED): ISO identifier (lowercase): ercot, caiso, pjm, miso, nyiso, isone, spp - start (OPTIONAL): Start date in YYYY-MM-DD or ISO 8601 format - end (OPTIONAL): End date in YYYY-MM-DD or ISO 8601 format - limit (OPTIONAL): Maximum number of rows to return (default varies by plan) - timezone (OPTIONAL): Timezone for results ("market" for ISO local time, or standard like "US/Eastern") EXAMPLES: - "What is current electricity demand in Texas?" → call with iso="ercot", start="latest" - "Show PJM load for yesterday" → call with iso="pjm", start="2026-04-06", end="2026-04-07" - "California load data this week" → call with iso="caiso", start="2026-04-01", limit=168 Get electricity load/demand data for a specific US ISO
get_realtime_lmp
This is the most granular and up-to-date pricing data available. USE WHEN: - User asks about current/real-time electricity prices - User needs 5-minute interval price data - User wants to track price spikes or volatility in real-time - User asks about live nodal pricing SUPPORTED ISOs: - pjm, caiso, miso, nyiso, isone, spp PARAMETERS: - iso (REQUIRED): ISO identifier - start (OPTIONAL): Start date/time (use "latest" for most recent) - end (OPTIONAL): End date/time - limit (OPTIONAL): Maximum rows (recommended to limit real-time data) - timezone (OPTIONAL): Timezone EXAMPLES: - "Current real-time LMP in PJM" → call with iso="pjm", start="latest", limit=12 - "CAISO 5-min prices right now" → call with iso="caiso", start="latest", limit=12 - "Last hour of real-time MISO prices" → call with iso="miso", start="latest", limit=12 Get real-time 5-minute LMP data for a US ISO
get_realtime_spp
Shows the most current wholesale electricity prices at trading hubs and zones in the Texas grid. USE WHEN: - User asks about current/real-time Texas electricity prices - User needs 15-minute interval SPP data for ERCOT - User wants to track price spikes or negative pricing in Texas - User asks about live ERCOT hub prices PARAMETERS: - start (OPTIONAL): Start date/time (use "latest" for most recent) - end (OPTIONAL): End date/time - limit (OPTIONAL): Maximum rows (recommended for real-time data) - timezone (OPTIONAL): Timezone EXAMPLES: - "Current ERCOT SPP at Houston hub" → call with start="latest", limit=4, filter_column="Settlement Point", filter_value="HB_HOUSTON" - "Last hour of Texas real-time prices" → call with start="latest", limit=4 - "ERCOT West hub prices today" → call with start="2026-04-07", filter_column="Settlement Point", filter_value="HB_WEST" Get ERCOT real-time 15-minute Settlement Point Price (SPP) data
get_spp_data
SPP is similar to LMP but specific to ERCOT's market design, showing prices at trading hubs, load zones, and resource zones. USE WHEN: - User asks about ERCOT electricity prices or SPP - User needs day-ahead price forecasts for Texas - User wants prices at specific ERCOT trading hubs (e.g. HB_HOUSTON, HB_NORTH, HB_WEST) - User asks about Texas wholesale electricity market prices PARAMETERS: - start (OPTIONAL): Start date - end (OPTIONAL): End date - limit (OPTIONAL): Maximum rows - timezone (OPTIONAL): Timezone (ERCOT uses US/Central) - filter_column (OPTIONAL): Column to filter (e.g. "Settlement Point") - filter_value (OPTIONAL): Hub/zone name to filter by EXAMPLES: - "ERCOT SPP for Houston hub tomorrow" → call with start="2026-04-08", filter_column="Settlement Point", filter_value="HB_HOUSTON" - "Texas day-ahead prices today" → call with start="2026-04-07" - "ERCOT SPP this week at North hub" → call with start="2026-04-01", filter_column="Settlement Point", filter_value="HB_NORTH" Get ERCOT Settlement Point Price (SPP) day-ahead hourly data
get_standardized_data
Useful for zonal/regional breakdowns of load, generation, or pricing with uniform schema across time periods. USE WHEN: - User needs consistently formatted hourly data for analysis - User asks for zonal or regional breakdowns - User wants standardized data for cross-ISO comparisons - User needs clean data for modeling or visualization SUPPORTED ISOs: - pjm (extensive zonal data), caiso, miso, others PARAMETERS: - iso (REQUIRED): ISO identifier - start (OPTIONAL): Start date - end (OPTIONAL): End date - limit (OPTIONAL): Maximum rows - timezone (OPTIONAL): Timezone EXAMPLES: - "PJM zonal load for today" → call with iso="pjm", start="2026-04-07" - "Standardized CAISO data this week" → call with iso="caiso", start="2026-04-01", limit=168 - "PJM hourly load yesterday" → call with iso="pjm", start="2026-04-06", end="2026-04-07" Get standardized hourly data for a US ISO with consistent column naming
list_datasets
Shows dataset identifiers, coverage dates, and available columns. USE WHEN: - User wants to explore what data is available in GridStatus - User needs to find dataset identifiers for querying - User is exploring the API capabilities for the first time - User asks what ISOs and data types are supported SUPPORTED ISOS: - ERCOT (Texas), CAISO (California), PJM (Mid-Atlantic/Midwest) - MISO (Midwest), NYISO (New York), ISO-NE (New England), SPP (Southwest) DATASET TYPES: - load (electricity demand), fuel_mix (generation by source) - lmp (locational marginal pricing), spp (settlement point prices) - capacity, standardized data EXAMPLES: - "What datasets are available?" → call with no params - "Show me all dataset identifiers" → call with no params - "List all supported ISOs" → call with no params List all available datasets in the GridStatus API
query_dataset
Use this when specific data needs are not covered by the specialized tools. USE WHEN: - User needs data from a specific dataset not covered by other tools - User wants custom filtering or resampling - User has a specific dataset identifier and needs flexible querying - User needs advanced filter operators PARAMETERS: - dataset_id (REQUIRED): Full dataset identifier (e.g. "pjm_load", "ercot_fuel_mix") - start (OPTIONAL): Start date - end (OPTIONAL): End date - limit (OPTIONAL): Maximum rows - timezone (OPTIONAL): Timezone for results - filter_column (OPTIONAL): Column name to filter on - filter_value (OPTIONAL): Value to filter by - filter_operator (OPTIONAL): Filter operator (=, !=, >, <, >=, <=, in) - resample (OPTIONAL): Resampling interval (e.g. "1 hour", "1 day") - resample_function (OPTIONAL): Aggregation function (mean, sum, min, max) EXAMPLES: - "Query pjm_load for last week" → call with dataset_id="pjm_load", start="2026-03-31", limit=168 - "ERCOT fuel mix resampled daily" → call with dataset_id="ercot_fuel_mix", start="2026-04-01", resample="1 day", resample_function="mean" - "CAISO load filtered for SDGE zone" → call with dataset_id="caiso_load", start="2026-04-07", filter_column="location", filter_value="SDGE" Query any GridStatus dataset with custom filters and parameters
Example Prompts for GridStatus in Claude Desktop
Ready-to-use prompts you can give your Claude Desktop agent to start working with GridStatus immediately.
"What is the current electricity demand in ERCOT (Texas)?"
"Show me the energy mix for California right now — how much comes from solar, wind, and natural gas?"
"What are day-ahead electricity prices for the PJM Houston hub tomorrow?"
Troubleshooting GridStatus MCP Server with Claude Desktop
Common issues when connecting GridStatus to Claude Desktop through the Vinkius, and how to resolve them.
Server not appearing after restart
~/Library/Application Support/Claude/claude_desktop_config.json (macOS) or %APPDATA%\\Claude\\ (Windows).Authentication error
Tools not showing in chat
GridStatus + Claude Desktop FAQ
Common questions about integrating GridStatus MCP Server with Claude Desktop.
How does Claude Desktop discover MCP tools?
claude_desktop_config.json file and connects to each configured MCP server. It calls the tools/list endpoint to fetch the schema for every available tool, then surfaces them as clickable options in the chat interface via the 🔌 icon.What happens if the MCP server is temporarily unavailable?
Can I connect multiple MCP servers simultaneously?
mcpServers section of the config file. Each server appears as a separate tool provider, and Claude can use tools from multiple servers in a single conversation turn.Is there a limit on the number of tools per server?
Does Claude Desktop support Streamable HTTP transport?
Connect GridStatus with your favorite client
Step-by-step setup guides for every MCP-compatible client and framework:
Anthropic's native desktop app for Claude with built-in MCP support.
AI-first code editor with integrated LLM-powered coding assistance.
GitHub Copilot in VS Code with Agent mode and MCP support.
Purpose-built IDE for agentic AI coding workflows.
Autonomous AI coding agent that runs inside VS Code.
Anthropic's agentic CLI for terminal-first development.
Python SDK for building production-grade OpenAI agent workflows.
Google's framework for building production AI agents.
Type-safe agent development for Python with first-class MCP support.
TypeScript toolkit for building AI-powered web applications.
TypeScript-native agent framework for modern web stacks.
Python framework for orchestrating collaborative AI agent crews.
Leading Python framework for composable LLM applications.
Data-aware AI agent framework for structured and unstructured sources.
Microsoft's framework for multi-agent collaborative conversations.
Connect GridStatus to Claude Desktop
Get your token, paste the configuration, and start using 12 tools in under 2 minutes. No API key management needed.