GridStatus MCP. Access US Electricity Load, Price, and Fuel Mix Data.
 Gemini
 Works with every AI agent you already use
…and any MCP-compatible client
Just plug in your AI agents and start using Vinkius.
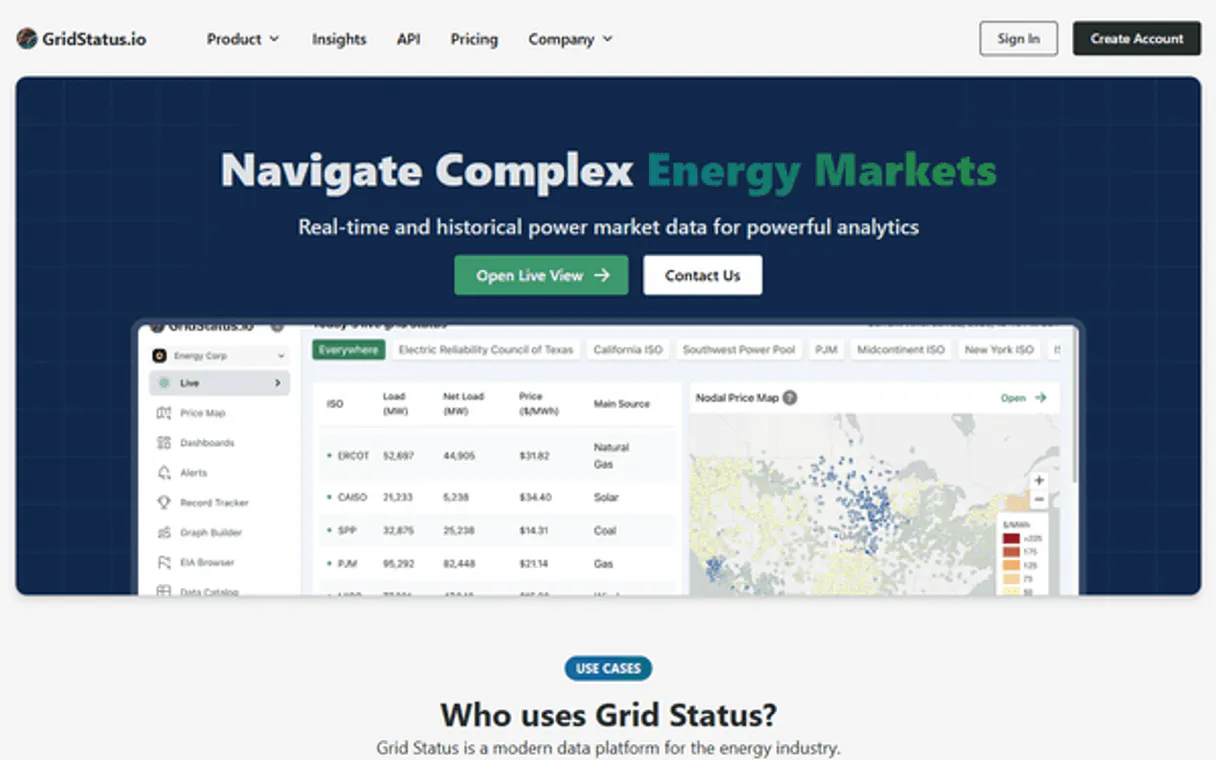
GridStatus connects your AI client to real-time and historical US electricity market data. Get load demand, wholesale pricing (LMP/SPP), fuel mix breakdowns, and capacity commitments across major ISOs like ERCOT, CAISO, PJM, and MISO.
What your AI agents can do
Get api usage
Checks your API quota and rate limits to see how many rows you've queried this month.
Get capacity data
Retrieves capacity market data, tracking resource adequacy commitments for a specified US ISO (e.g., PJM).
Get dataset metadata
Lists the date range and available columns for any specific dataset ID before you run a query.
Retrieves real-time or historical electricity load/demand data (MW) for any specified US ISO region.
Accesses live 5-minute LMP and 15-minute SPP prices across various nodes to pinpoint price spikes and arbitrage opportunities.
Gets a detailed breakdown of power generation by source (coal, solar, wind, gas) for specific US ISOs, tracking the renewable transition.
Uses query_dataset to run advanced filtering and resampling on almost any available dataset ID with custom logic.
Checks your current quota, row counts, and rate limits using the get_api_usage tool.
Ask AI about this MCP
Supported MCP Clients
Gemini Waiting for input…
GridStatus MCP Server: 12 Tools for Energy Data Analysis
These tools let your agent query every aspect of the US electrical grid—from live pricing to historical capacity commitments—in a structured, reliable way.
019d75abget api usage
Checks your API quota and rate limits to see how many rows you've queried this month.
019d75abget capacity data
Retrieves capacity market data, tracking resource adequacy commitments for a specified US ISO (e.g., PJM).
019d75abget dataset metadata
Lists the date range and available columns for any specific dataset ID before you run a query.
019d75abget fuel mix
Provides generation breakdowns by fuel source (solar, wind, gas) for key US ISOs like Texas and California.
019d75abget lmp data
Gets day-ahead Locational Marginal Pricing forecasts across multiple nodes in a specified US ISO.
019d75abget load data
Retrieves the total electricity demand (MW) for an entire US ISO over a defined time period.
019d75abget realtime lmp
Streams current 5-minute LMP price data for various nodes across major US ISOs.
019d75abget realtime spp
Gets the most up-to-date 15-minute Settlement Point Price (SPP) data specific to the Texas ERCOT grid.
019d75abget spp data
Retrieves day-ahead hourly SPP forecasts for specific trading hubs and zones within the ERCOT market.
019d75abget standardized data
Fetches standardized hourly data with consistent column names, ideal for cross-ISO comparisons or modeling.
019d75ablist datasets
Lists all available dataset identifiers and types (load, lmp, fuel_mix) in the entire GridStatus API.
019d75abquery dataset
Allows you to query any specific dataset with advanced filters, resampling intervals, and custom aggregations.
Choose How to Get Started
Build a custom MCP for your own tools, or connect a ready-made integration from our catalog.
Build Your Own
Turn any API into an MCP. Import a spec, define Agent Skills, or deploy with MCPFusion.
- Import from OpenAPI, Swagger, or YAML specs
- Create Agent Skills with progressive disclosure
- Deploy to edge with MCPFusion framework
- Built in DLP, auth, and compliance on every call
- Real time usage dashboard and cost metering
- Publish to catalog or keep private
Make Your AI Do More
Start with GridStatus, then connect any of our 4,700+ other servers whenever your AI needs more. One click, no limits.
- Use this MCP plus 4,700+ others, all in one place
- Add new capabilities to your AI anytime you want
- Every connection is secured and compliant automatically
- Track usage and costs across all your servers
- Works with Claude, ChatGPT, Cursor, and more
- New servers added to the catalog every week
What you can do with this MCP connector
This server connects your AI client directly to the whole US electricity market—load demand, wholesale pricing, and generation mix—through one place. You'll track grid dynamics across every major Independent System Operator (ISO).
Tracking Demand & Supply:
When you need to know how much power a region is using, use get_load_data to pull the total electricity demand in megawatts (MW) for an entire US ISO over any time period. For immediate snapshots of current consumption or historical load metrics, the tool gives you that data.
Need general market coverage? Run list_datasets first; it shows all available dataset identifiers and types—like load, LMP, and fuel_mix—so you know exactly what's in the API.
Analyzing Pricing Volatility:
Want to pinpoint where prices are spiking or where arbitrage opportunities pop up? You use get_realtime_lmp to stream current 5-minute Locational Marginal Pricing (LMP) data across multiple nodes within major US ISOs. For a more granular look at Texas, the tool provides the most up-to-date 15-minute Settlement Point Price (SPP) data specific to the ERCOT grid via get_realtime_spp.
If you're planning ahead, you can grab day-ahead LMP forecasts across multiple nodes in a specified US ISO using get_lmp_data. For ERCOT trading hubs and zones, run get_spp_data to retrieve day-ahead hourly SPP forecasts. When you need consistent data for modeling or comparing states, use get_standardized_data; it fetches standardized hourly records with column names that match up across ISOs.
Modeling Energy Mix Shifts:
To track the renewable transition—the mix of power generation—you run get_fuel_mix. This tool provides detailed breakdowns by fuel source (like solar, wind, and gas) for key US ISOs like Texas and California. Beyond just the mix, you can also access long-term planning data using get_capacity_data, which tracks resource adequacy commitments for a specific US ISO, such as PJM.
Deep Data Querying & Management:
For advanced research, your agent doesn't stop at simple pulls. You use query_dataset to run deep queries on almost any available dataset ID. This tool lets you apply custom filters, choose resampling intervals, and perform specific aggregations—you write the logic, and it executes the query against the data.
If you only want to see what parameters are available before writing a complex query, check get_dataset_metadata; this lists the date range and all available columns for that dataset ID. Finally, if you're running heavy queries, don't sweat the usage limits; use get_api_usage to check your current API quota and rate limits, so you always know how many rows you've queried this month.
How GridStatus MCP Works
- 1 1. Subscribe to the GridStatus server and provide your API key.
- 2 2. Your AI client calls a specific tool, like
get_realtime_lmp, passing necessary parameters (e.g., ISO='pjm', start='latest'). - 3 3. The server executes the query against the underlying data source and returns structured JSON containing the requested electricity metrics.
The bottom line is, your AI agent handles all the complex API calls; you just ask a question about energy or pricing, and it gets the answer.
Who Is GridStatus MCP For?
This is for the power users: Energy Traders who need to spot arbitrage gaps between nodes. It's also critical for Climate Researchers analyzing state-by-state renewable adoption, or Corporate Sustainability teams needing regional load data for facility planning.
Uses get_realtime_lmp and get_spp_data to monitor live pricing at specific trading hubs and identify potential buy/sell opportunities.
Calls get_fuel_mix and query_dataset to pull historical data, quantifying the shift from fossil fuels to renewables in different ISOs.
Uses get_capacity_data to track resource adequacy metrics or runs load simulations with get_load_data for long-term planning.
What Changes When You Connect
- Track immediate pricing shifts. Use
get_realtime_lmporget_realtime_sppto monitor live 5-minute/15-minute prices and catch price spikes instantly. This is critical for identifying arbitrage opportunities across nodes. - Understand the energy transition. The
get_fuel_mixtool gives you a clean breakdown of generation by source (wind, solar, gas). You can track how much renewable energy contributes to total output in any ISO. - Build reliable models. Instead of grabbing raw data and hoping it's consistent, use
get_standardized_data. It formats hourly metrics with uniform column names across different US regions for clean analysis. - Go beyond the basics. If a specialized tool doesn't fit—say you need to average load over five years—use
query_datasetfor custom filtering and resampling logic on any dataset ID. - Manage complexity. When your agent runs into data structure issues, use
get_dataset_metadata. It tells you exactly which columns exist and what the date coverage is before you write a single line of query code.
Real-World Use Cases
Modeling Peak Demand
The engineering team needs to model how peak load shifts as solar capacity increases. They use get_load_data for California (CAISO) over a year, then pass the raw data through query_dataset to resample it by month and calculate the rolling average demand.
Spotting Arbitrage in Texas
A trader needs to know if prices are diverging between zones. They call get_realtime_spp for several settlement points (e.g., HB_HOUSTON, HB_NORTH) and immediately compare the live 15-minute intervals to find a price difference large enough to execute a trade.
Comparing Inter-State Mixes
A sustainability analyst wants to report on clean energy progress. They run get_fuel_mix separately for PJM and MISO, then use the structured output from both calls in their final document, directly comparing solar/wind percentage across two different grids.
Forecasting Next Quarter's Costs
A corporate planning agent needs to budget. It uses get_lmp_data for the PJM region, setting the start and end dates a few months out, allowing them to forecast the expected cost of electricity for facility budgeting.
The Tradeoffs
Using only generic data calls
Trying to find real-time pricing by calling query_dataset with a general filter. The result is messy, unstructured, and you have to manually determine if the price is 5-minute or hourly.
→
Always use the dedicated tools first. For live prices, call get_realtime_lmp (for general ISOs) or get_realtime_spp (for ERCOT). This guarantees the correct time interval and data format.
Assuming dataset existence
The agent tries to query a specific dataset ID like pjm_load, but gets an 'ID not found' error because the schema changed. The whole process fails.
→
Always check first using list_datasets or, if you know the general area, use get_dataset_metadata with the suspected ID. This validates the data source before running a query.
Using today's date for historical analysis
Calling any time-series tool and only providing 'today' as the start/end date, which limits your scope to 24 hours when you need monthly trends.
→
When running long-term analyses (e.g., year-over-year load comparisons), specify a proper start and end range that spans the desired time window, or use query_dataset with a resample function.
When It Fits, When It Doesn't
Use this server if your primary need involves tracking high-frequency energy metrics: MW demand, $/MWh pricing (LMP/SPP), or generation mix shifts. If you're dealing with time series data in the power sector, this is it.
Don't use this if your goal is general business intelligence—like querying HR records or tracking sales leads; those need a different kind of server. Also, don't try to build complex financial models without knowing which specific tool handles nodal pricing versus zonal forecasting (LMP vs SPP). Always check the documentation for get_realtime_lmp if you need general ISO prices, and use get_realtime_spp only when dealing with ERCOT.
If you're unsure what data exists or which tool to call, start by running list_datasets. It’s your diagnostic check.
Independent Platform Disclaimer: Vinkius is an independent platform and is not affiliated with, endorsed by, sponsored by, verified by, or otherwise authorized by GridStatus. All third-party trademarks, logos, and brand names are the property of their respective owners. Their use on this website is strictly for informational purposes to identify service compatibility and interoperability.
VINKIUS INFRASTRUCTURE
Cloud Hosted
Managed infra
V8 Isolated
Sandboxed per request
Zero-Trust Proxy
No stored credentials
DLP Enforced
Policy on every call
GDPR Compliant
EU data residency
Token Compression
~60% cost reduction
Works with Claude, ChatGPT, Cursor, and more
The Model Context Protocol standardizes how applications expose capabilities to LLMs. Instead of operating in isolation, your AI gains direct access to external platforms, live data, and real-world actions through secure, standardized connections.
This server provides 12 capabilities that interface natively with Claude, ChatGPT, Cursor, and any MCP client. No middleware. No custom integration required.
Available Capabilities
Finding grid metrics shouldn't require knowing the exact ISO acronym and dataset ID.
Today, getting a simple picture of regional energy status means switching between three different dashboards: one for load (MW), one for pricing ($/MWh), and another for fuel mix. You spend time copying dates, pasting IDs, and cross-referencing column names just to build a single comparison chart.
With GridStatus MCP Server, your agent handles the data routing. You ask it, 'Show me California's load vs. its renewable generation last quarter.' It runs multiple specialized tools (`get_load_data`, `get_fuel_mix`) and returns one clean object with all the necessary metrics.
Using GridStatus MCP Server: Get real-time price data with get_realtime_lmp.
Before, getting live pricing meant manually logging into a terminal or website and refreshing the dashboard every five minutes. You had to watch for that specific node name you were tracking—and if the service went down for two minutes, your whole analysis stopped.
Now, calling `get_realtime_lmp` pulls those 5-minute intervals directly into your agent's context. The data stream is available immediately and reliably, letting your code react instantly to price swings.
Common Questions About GridStatus MCP
What does the get_fuel_mix tool track? +
The get_fuel_mix tool tracks how electricity generation is distributed by source (coal, gas, wind, etc.) for specific ISOs. It's key to understanding clean energy adoption rates.
Can I get live prices in Texas? +
Yes, use get_realtime_spp for the most current 15-minute Settlement Point Price (SPP) data specific to the ERCOT grid. It’s different from general LMP.
How do I find out what data is available? +
You must call list_datasets. This tool shows all dataset identifiers and tells you exactly which types of data—load, lmp, fuel_mix—are stored in the server.
Is LMP the same as SPP? +
No. LMP is a general measure used across many ISOs (get_realtime_lmp). SPP is specific to ERCOT's market design and is available via get_realtime_spp.
What if I need custom filtering? +
If the specialized tools don't cover your exact criteria, use query_dataset. This lets you specify a dataset ID and apply advanced filters or aggregation functions yourself.
How do I check my usage quota using the `get_api_usage` tool? +
The get_api_usage tool reports your current consumption and remaining row allowance. It lets you track rate limits and see exactly how many rows you’ve pulled this month without affecting other queries.
What is the purpose of running a query with the `get_capacity_data` tool? +
This tool focuses on long-term resource adequacy and capacity commitments for specific ISOs. You use it to plan for future generation needs, not to monitor day-to-day pricing or real-time demand.
If I'm unsure about a dataset structure, how do I check the schema using `get_dataset_metadata`? +
The get_dataset_metadata tool tells you the exact column names and valid date ranges for any specific dataset ID. This helps validate your parameters before running complex queries.
Which US electricity grid operators (ISOs) are supported? +
The GridStatus API supports all major US Independent System Operators: ERCOT (Texas), CAISO (California), PJM (Mid-Atlantic/Midwest), MISO (Midwest), NYISO (New York), ISO-NE (New England), and SPP (Southwest/Central). Each ISO provides different datasets including load, fuel mix, LMP pricing, and standardized data depending on what they report.
How do I get a GridStatus API key and what are the usage limits? +
Visit https://www.gridstatus.io/ and create a free account. Your API key will be available in your account settings. The free tier includes 500,000 rows per month, which is sufficient for most research and analysis use cases. Use the get_api_usage tool to monitor your remaining quota. Higher tiers are available for commercial applications requiring more data access.
What is the difference between LMP and SPP pricing data? +
LMP (Locational Marginal Pricing) is used by most ISOs (PJM, CAISO, MISO, NYISO, ISO-NE, SPP) and represents the wholesale electricity price at specific nodes. SPP (Settlement Point Price) is ERCOT's equivalent for Texas. Both measure $/MWh but use different market mechanisms. LMP has day-ahead hourly and real-time 5-minute intervals. ERCOT SPP has day-ahead hourly and real-time 15-minute intervals. Both include prices at trading hubs (e.g. HB_HOUSTON, HB_NORTH), load zones, and resource zones.
Can I get renewable energy percentage data from the fuel mix? +
Yes! Use the get_fuel_mix tool with ISOs that support it (ERCOT, CAISO, ISO-NE). The response includes generation breakdown by source: solar, wind, hydro, natural_gas, coal, nuclear, and others. You can calculate the renewable percentage by summing solar + wind + hydro and dividing by total generation. Note that fuel mix data availability varies by ISO — ERCOT and CAISO have the most comprehensive renewable tracking.
Use it with your favorite AI tools
Connect this server to Cursor, Claude, VS Code, and more.
More in this category

Watershed Climate
Automate carbon measurement and reporting via Watershed — manage inventories, upload emissions data, and track reduction targets directly from any AI agent.

RCSB PDB
Explore 220K+ 3D molecular structures — search proteins, DNA, and RNA by name, experimental method, resolution, and bound ligands from the Protein Data Bank.

Farmonaut
Access satellite agriculture data via Farmonaut — monitor crop health with NDVI, weather, soil moisture, crop advisory, and deforestation alerts from any AI agent.
You might also like

Harvard WHO Health
Access WHO global health indicators, disease statistics, and population health data for evidence-based research and policy analysis.

OpenStates
US state legislative data platform — track bills, legislators, and committees via AI.

Kontent.ai (Enterprise Headless CMS)
Manage enterprise content via Kontent.ai — create items, publish language variants, and audit content types.