LangSmith (LLM Observability & Hub) MCP. Audit agent traces and measure model performance via conversation.
 Gemini
 Works with every AI agent you already use
…and any MCP-compatible client
Just plug in your AI agents and start using Vinkius.
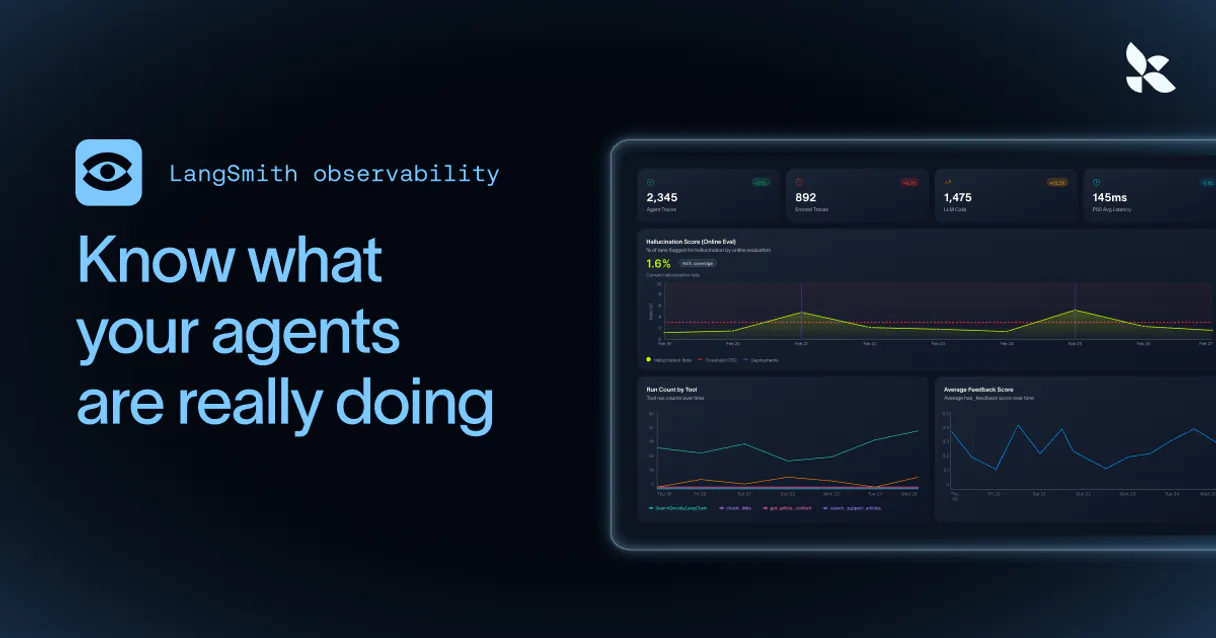
LangSmith (LLM Observability & Hub) connects your AI agent to your entire LLM infrastructure. It lets you track every step an AI takes, from initial prompt to final output.
You can get detailed metrics like token count and latency, audit prompt templates, and view datasets used for evaluation—all through natural conversation with your AI client.
It’s deep visibility into your LLM pipelines, without opening a dashboard.
What your AI agents can do
Get run
Gets precise metrics for a single LLM invocation run.
List annotation queues
Lists active human-in-the-loop annotation queues.
List datasets
Lists all evaluation and fine-tuning datasets mapped in LangSmith.
Gets precise metrics for a single LLM invocation run, including token counts and latency.
Retrieves a list of active human-in-the-loop annotation queues for review.
Retrieves all evaluation and fine-tuning datasets mapped within LangSmith.
Maps out the boundaries of distinct AI pipelines, listing all active LangSmith tracing projects.
Retrieves prompt templates and definitions hosted in the LangChain Hub.
Lists raw interactions, showing prompts sent to and responses received from the AI models within a specific project.
Ask AI about this MCP
Supported MCP Clients
Gemini Waiting for input…
LangSmith (LLM Observability & Hub) MCP Server: 6 Tools
Manage pipeline boundaries, collect run data, and list prompt templates across your entire LLM infrastructure.
019d75c4get run
Gets precise metrics for a single LLM invocation run.
019d75c4list annotation queues
Lists active human-in-the-loop annotation queues.
019d75c4list datasets
Lists all evaluation and fine-tuning datasets mapped in LangSmith.
019d75c4list projects
Lists all active LangSmith tracing projects/sessions.
019d75c4list prompts
Extracts prompt templates hosted in the LangChain Hub.
019d75c4list runs
Lists explicit LLM invocation runs within a specific project.
Choose How to Get Started
Build a custom MCP for your own tools, or connect a ready-made integration from our catalog.
Build Your Own
Turn any API into an MCP. Import a spec, define Agent Skills, or deploy with MCPFusion.
- Import from OpenAPI, Swagger, or YAML specs
- Create Agent Skills with progressive disclosure
- Deploy to edge with MCPFusion framework
- Built in DLP, auth, and compliance on every call
- Real time usage dashboard and cost metering
- Publish to catalog or keep private
Make Your AI Do More
Start with LangSmith (LLM Observability & Hub), then connect any of our 4,700+ other servers whenever your AI needs more. One click, no limits.
- Use this MCP plus 4,700+ others, all in one place
- Add new capabilities to your AI anytime you want
- Every connection is secured and compliant automatically
- Track usage and costs across all your servers
- Works with Claude, ChatGPT, Cursor, and more
- New servers added to the catalog every week
What you can do with this MCP connector
LangSmith connects your AI agent to your entire LLM infrastructure. You can track every step an agent takes, from the initial prompt to the final output. You'll get deep visibility into your LLM pipelines without having to open a dashboard.
get_run: Pulls precise metrics for a single LLM invocation run, letting you see things like token counts and latency.list_annotation_queues: Shows you a list of active human-in-the-loop annotation queues for review.list_datasets: Lists all the evaluation and fine-tuning datasets mapped within LangSmith.list_projects: Maps out the boundaries of distinct AI pipelines, listing all active LangSmith tracing projects.list_prompts: Extracts prompt templates and definitions hosted in the LangChain Hub.list_runs: Lists raw interactions, showing the prompts sent to and the responses received from the AI models within a specific project.
How LangSmith (LLM Observability & Hub) MCP Works
- 1 Subscribe to this server.
- 2 Enter your LangSmith API Key and Endpoint into the client.
- 3 Start monitoring your LLM infrastructure from your AI client.
The bottom line is, your agent accesses your entire LLM pipeline data through the LangSmith API keys you provide.
Who Is LangSmith (LLM Observability & Hub) MCP For?
LLM Engineers and AI Developers who spend too much time clicking through dashboard filters just to find a specific error or metric. This is for the analyst who needs to audit model behavior across dozens of projects without leaving their chat window.
Debugging complex agentic traces and measuring prompt performance by asking the agent questions instead of using manual UI filters.
Retrieving the latest prompt templates from the Hub and verifying evaluation dataset structures directly from their development workspace.
Auditing human feedback queues and generating reports on overall model grounding and accuracy across multiple tracing projects.
What Changes When You Connect
- Deep Tracing: Instead of navigating complex UIs, you ask the agent to list all active projects using
list_projectsand drill down into any run usinglist_runs. You see the full history of agent thought. - Performance Metrics:
get_rungives you raw telemetry—token consumption, prompt latency, and exact error strings. You get numbers, not guesswork, on model efficiency. - Prompt Management: Need to check a prompt's version history? Use
list_promptsto pull templates straight from the LangChain Hub. No need to switch tabs or search a repository. - Evaluation Audit: Use
list_datasetsto view the 'golden' datasets. You can verify the exact structure used for automated evaluation, keeping your model reliable. - Human Oversight:
list_annotation_queueslets you monitor human review queues. You track safety and alignment scores without leaving your main workflow. - Multi-Project View: Quickly scope your entire operation.
list_projectsprovides a map of every distinct AI pipeline, helping you manage technical debt across your whole stack.
Real-World Use Cases
Debugging a Failure in Production
The agent fails unexpectedly. Instead of manually searching the dashboard, you ask the agent to list_projects to narrow down the service. Then you ask to list_runs for the specific time window and use get_run to get the token count and error string. You find the exact failure point in seconds.
Updating a Core Prompt Template
The product team mandates a change to a key summarization prompt. You ask the agent to list_prompts to see all available versions and variable definitions. You retrieve the latest template and verify the version history before the developer applies the update.
Checking Model Accuracy for a New Feature
Before deploying a new RAG system, you need to test it against known failure cases. You ask the agent to list_datasets to get the 'golden' test set and then use list_runs to check the outputs against that dataset, confirming accuracy.
Reviewing Agent Safety and Bias
You suspect the agent might be giving biased answers. You ask the agent to list_annotation_queues to see the queue of human reviewers. You review the flagged traces and report on the model's grounding and safety issues.
The Tradeoffs
Trying to find run metrics manually
Logging into the LangSmith dashboard, navigating to the correct project, finding the right run ID, and then clicking through multiple tabs to get the token count and latency.
→
Just ask the agent: 'What were the token usage and latency for the last run in the Production-Bot-V2 project?' The agent uses list_projects and then get_run to deliver the numbers immediately.
Forgetting which prompt version to use
A developer updates a prompt in the Hub, but the running code uses an old, unversioned template, leading to unpredictable behavior.
→
Use list_prompts to view all managed templates. You can pull the full instruction text and version history, ensuring your agent always uses the correct, approved version.
Scope Creep on Debugging
A developer starts by listing projects, then gets lost in 20 different runs, trying to manually correlate the data across multiple tabs to understand the failure point.
→
Start by using list_projects to scope the failure. Then, ask the agent to list_runs for that specific project and narrow the scope down to the problematic run ID. This focuses the investigation immediately.
When It Fits, When It Doesn't
Use this if you need to audit, measure, or manage the lifecycle of your LLM pipelines without opening a separate web dashboard. This is for engineers who need immediate, data-backed answers about model performance, prompt versions, or agent logic.
Don't use this if your only goal is to visualize data trends over months or years—you'll need a dedicated BI tool. Don't use this if you only need to store basic, un-traced chat logs—a simple database works. Use this when the process of failure and success needs to be tracked, measured, and interrogated via natural language.
When in doubt, check if you need to know why something happened (the trace) or how well it performed (the metrics). If the answer is yes, you need LangSmith.
Independent Platform Disclaimer: Vinkius is an independent platform and is not affiliated with, endorsed by, sponsored by, verified by, or otherwise authorized by LangSmith. All third-party trademarks, logos, and brand names are the property of their respective owners. Their use on this website is strictly for informational purposes to identify service compatibility and interoperability.
VINKIUS INFRASTRUCTURE
Cloud Hosted
Managed infra
V8 Isolated
Sandboxed per request
Zero-Trust Proxy
No stored credentials
DLP Enforced
Policy on every call
GDPR Compliant
EU data residency
Token Compression
~60% cost reduction
Works with Claude, ChatGPT, Cursor, and more
The Model Context Protocol standardizes how applications expose capabilities to LLMs. Instead of operating in isolation, your AI gains direct access to external platforms, live data, and real-world actions through secure, standardized connections.
This server provides 6 capabilities that interface natively with Claude, ChatGPT, Cursor, and any MCP client. No middleware. No custom integration required.
Available Capabilities
Debugging LLM pipelines used to mean hours of dashboard clicking.
Before this server, debugging a single complex agentic run was a pain. You'd have to manually navigate the LangSmith UI, find the correct project, locate the run ID, and then click through dozens of tabs—one for input, one for output, one for tool calls, one for metrics. It was slow, and you always missed something.
Now, you just ask your agent: 'What were the token metrics and latency for the last run in Production-Bot-V2?' The agent runs `get_run` and spits out the numbers and the full trace directly in the chat. It’s immediate, specific, and keeps you in your flow.
LangSmith (LLM Observability & Hub) MCP Server: Get full control of your LLM data.
You no longer have to rely on scattered data points. You can use `list_prompts` to pull the official, version-controlled prompt template from the LangChain Hub, and then use `list_runs` to see exactly how that template performed in the wild.
This means your entire LLM lifecycle—from template creation to live execution—is auditable from one place. You own the data, and you own the model performance.
Common Questions About LangSmith (LLM Observability & Hub) MCP
How do I use the get_run tool in LangSmith (LLM Observability & Hub) MCP Server? +
You provide the run ID and project ID. This tool returns specific telemetry: total tokens, prompt tokens, completion tokens, and latency. It's the fastest way to check a single execution's performance.
What is the difference between list_runs and list_projects using LangSmith (LLM Observability & Hub) MCP Server? +
Use list_projects first to see the high-level boundaries (all active pipelines). Then, use list_runs to get a list of individual, raw interactions within one of those projects.
Can I check for human review queues using list_annotation_queues in LangSmith (LLM Observability & Hub) MCP Server? +
Yes. This tool lists all active annotation queues. This lets you monitor human feedback, which is key for auditing model safety and alignment.
How does list_prompts help with prompt versioning in LangSmith (LLM Observability & Hub) MCP Server? +
It extracts managed prompt templates from the LangChain Hub. You get the full instruction text and the version history, which prevents your agent from accidentally using an outdated prompt.
How do I use list_datasets to check for evaluation data for a specific model? +
It lists all evaluation and fine-tuning datasets mapped in LangSmith. This lets you quickly see which 'golden' datasets are ready for automated testing of your prompt logic or few-shot models.
What is the difference between list_runs and get_run using LangSmith (LLM Observability & Hub) MCP Server? +
list_runs gives you a list of raw interactions, showing prompts sent and responses received for a project. get_run retrieves precise telemetry for a single, specific LLM invocation run, giving you detailed metrics like token count and latency.
Can I use list_projects to find out which AI pipelines are actively being monitored? +
list_projects maps out the boundaries of distinct AI pipelines. Running this tool shows all active LangSmith tracing projects, helping you keep track of every monitored session.
How do I use list_annotation_queues to check the status of human review tasks? +
It lists all active human-in-the-loop annotation queues. This lets you monitor where human reviewers are assessing the alignment, accuracy, and safety of generated LLM traces.
Can I see the token usage for a specific LLM run through my agent? +
Yes. Use the get_run_telemetry tool with a specific Run ID. Your agent will retrieve the exact token count (prompt + completion) and latency metrics calculated by LangSmith for that interaction.
How do I fetch a prompt template from the LangChain Hub using natural language? +
The list_prompts tool allows your agent to navigate your hosted Hub repository. You can ask your agent to find a specific prompt by name to inspect its instruction text, variables, and version history.
Can my agent check the status of human annotation queues? +
Absolutely. Use the list_annotation_queues tool to retrieve all active queues where human feedback is being collected. Your agent can report on the number of pending traces and general alignment scores established by your reviewers.
Use it with your favorite AI tools
Connect this server to Cursor, Claude, VS Code, and more.
More in this category

LangGraph Cloud (Stateful AI Agents)
Orchestrate stateful AI agents via LangGraph Cloud — manage assistants, monitor conversation threads, and handle human-in-the-loop overrides.

Modal (Serverless AI Infrastructure)
Manage serverless compute via Modal — audit active apps, track GPU deployments, and monitor network volumes.

NVIDIA NIM
MLOps proxy unifying explicitly local hardware limits extracting telemetry across active NVIDIA AI containers.
You might also like
Capacities
Empower your AI agents to build knowledge graphs, append daily notes, and save weblinks directly into your Capacities spaces.
Timeero
Track employee time and mileage with GPS-verified clock-ins that generate accurate timesheets for field service teams.

ThirdWeb
Integrate Web3 capabilities into your AI agent — manage wallets, authenticate users, and interact with smart contracts across multiple blockchains.