LoadNinja MCP. Control Real-Browser Load Testing from Chat
 Gemini
 Works with every AI agent you already use
…and any MCP-compatible client
Just plug in your AI agents and start using Vinkius.
LoadNinja provides full control over real-browser load testing via an MCP Server. It lets your AI agent trigger complex performance scenarios, monitor live metrics across global data centers, and audit virtual user limits—all through natural conversation.
You get deep insights into throughput, peak VUs, and transaction lengths without leaving your chat interface.
What your AI agents can do
Get account
Retrieves your specific LoadNinja account details and current runtime Virtual User limits.
Get scenario
Pulls the full configuration, including target URLs, for a single load test scenario.
Get test run
Gets the complete summary and details of a specific test run that has already finished.
Use the agent to start a test run (run_scenario) or immediately halt an active test cycle (stop_test_run).
List all existing scenarios (list_scenarios), check available physical locations (list_locations), and see which native browsers are configured.
Pull summaries of completed test runs (get_test_run) or fetch the raw statistics needed for deep bottleneck analysis (get_test_run_stats).
Check your specific subscription details and runtime Virtual User limits using get_account, or pull a full configuration tree for any given scenario via get_scenario.
List all test executions (list_test_runs) to see which tests are active, completed, or failed. Get the specific details of a finished run (get_test_run).
Ask AI about this MCP
Supported MCP Clients
Gemini Waiting for input…
LoadNinja (Real-Browser Load Testing) MCP Server: 10 Tools
Use these tools to manage the entire performance testing lifecycle in LoadNinja. Trigger runs, retrieve raw stats, and audit system configurations with simple chat commands.
019d75c9get account
Retrieves your specific LoadNinja account details and current runtime Virtual User limits.
019d75c9get scenario
Pulls the full configuration, including target URLs, for a single load test scenario.
019d75c9get test run
Gets the complete summary and details of a specific test run that has already finished.
019d75c9get test run stats
Retrieves raw, granular performance statistics for an entire completed load test execution.
019d75c9list browsers
Lists all explicit native browser types configured and available for testing.
019d75c9list locations
Shows a list of physical data center locations where load injection can occur globally.
019d75c9list scenarios
Retrieves the names and IDs of all defined load test scenarios in your account.
019d75c9list test runs
Lists all historical or currently active test executions, showing their status (running, complete, failed).
019d75c9run scenario
Starts a load test by running a specified scenario with a set number of virtual users and duration in minutes.
019d75c9stop test run
Immediately terminates an active, running load test to free up system resources or stop erroneous cycles.
Choose How to Get Started
Build a custom MCP for your own tools, or connect a ready-made integration from our catalog.
Build Your Own
Turn any API into an MCP. Import a spec, define Agent Skills, or deploy with MCPFusion.
- Import from OpenAPI, Swagger, or YAML specs
- Create Agent Skills with progressive disclosure
- Deploy to edge with MCPFusion framework
- Built in DLP, auth, and compliance on every call
- Real time usage dashboard and cost metering
- Publish to catalog or keep private
Make Your AI Do More
Start with LoadNinja (Real-Browser Load Testing), then connect any of our 4,700+ other servers whenever your AI needs more. One click, no limits.
- Use this MCP plus 4,700+ others, all in one place
- Add new capabilities to your AI anytime you want
- Every connection is secured and compliant automatically
- Track usage and costs across all your servers
- Works with Claude, ChatGPT, Cursor, and more
- New servers added to the catalog every week
What you can do with this MCP connector
You connect your AI agent to the LoadNinja MCP Server; it gives you full control over real-browser load testing, right from your chat window. You don't need reports exported manually—your agent handles everything from setup through deep analysis using natural language.
Initiating and Controlling Tests
You can start a whole test run with run_scenario, letting the agent know which scenario you want to use, how many virtual users (VUs) you're throwing at the site, and for how long it should run in minutes. If something goes sideways or if you just need to cut bait, you can instantly stop an active cycle using stop_test_run to free up resources.
Discovering Your Setup
Before you hit start, you gotta know what's available. Use list_scenarios to pull a list of every single load test scenario already set up in your account; this tells you the names and IDs you can use later. For infrastructure checks, run list_locations to see all the physical data center locations globally where load injection is possible.
You'll also want to check which native browsers are configured by running list_browsers, so you know exactly what types of client environments your test will simulate.
Checking Your Limits and Details
To make sure you don't run into trouble, use get_account to pull your specific LoadNinja account details and check your current runtime Virtual User limits. If you need a deep dive on the setup itself, get_scenario pulls the full configuration for any given scenario, including all target URLs, giving you a complete blueprint of what's going to run.
Monitoring Live Activity and Results
Tracking what's happening live is key. You can list every test execution—active ones, completed ones, or failures—with list_test_runs. For the specifics on a test that's already finished, get_test_run pulls the complete summary and all the details for that specific run. When you need to dig into why something slowed down, get_test_run_stats retrieves raw, granular performance statistics across an entire completed load test execution.
Analyzing Deep Performance Data
The tools let you pull summaries of finished runs with get_test_run, tracking throughput figures, peak VU mappings, and transaction lengths. For the deepest diagnostics—the stuff that pinpoints bottlenecks under heavy application stress—you're gonna use get_test_run_stats to grab those raw server response times and performance metrics. You don't gotta manually export anything; your agent handles the data pull for you.
How LoadNinja MCP Works
- 1 Subscribe to the server and input your LoadNinja API Key.
- 2 Prompt your agent with a command, like 'Run scenario X for 50 VUs.', specifying exactly what you need.
- 3 The agent calls the necessary tool (
run_scenario), executes the test, and returns real-time status updates or final metrics.
The bottom line is: You manage complex, multi-stage performance tests using only conversation. No dashboard clicks needed.
Who Is LoadNinja MCP For?
Performance Engineers who are tired of juggling manual dashboards and API calls need this. It's for the QA Automation team that needs to prove a regression instantly, or the DevOps engineer who has to audit global VUs before a deployment.
Triggers complex load scenarios and asks for specific throughput metrics without exporting CSVs.
Checks test run completion statuses and verifies if performance regressions occurred directly from their workspace.
Audits the virtual user (VU) limits and global data center availability to ensure scalability before a major release.
What Changes When You Connect
- Instantly get deep performance metrics. Instead of downloading a report, you prompt the agent to call
get_test_run_statsand see raw throughput and P95 transaction times right away. - Manage global infrastructure limits with zero effort. Use
get_accountto check your current VU cap or uselist_locationsto audit available data centers for a new deployment region. - Run high-fidelity tests on demand. Just call
run_scenario, specifying VUs and duration, and watch the agent initiate the test without you leaving your workspace. - Control system resources when things break. If a test runs wild or fails early, use
stop_test_runto vaporize it instantly—no need to log into the web UI. - Never lose track of tests again. Use
list_test_runsto see every active and completed run status at a glance. Then callget_test_runfor the final summary. - Understand your setup in seconds. Call
list_scenariosfirst, then useget_scenarioon one ID to pull its exact configuration details.
Real-World Use Cases
The critical pre-release check
A DevOps engineer needs to confirm the global scalability before launch. They ask their agent: 'What are our VU limits and where can we run?' The agent calls get_account and list_locations, confirming both capacity and physical reach, which eliminates manual dashboard checks.
Pinpointing a hidden bottleneck
A QA team member suspects the checkout page slows down under load. They ask the agent to run a test using run_scenario for 10 minutes. After completion, they immediately call get_test_run_stats, which returns raw response times showing exactly when the P95 transaction duration spiked.
Halt an runaway test
A developer starts a high-volume test but realizes it's hitting unintended endpoints. They tell their agent, 'Stop run ID XYZ.' The agent calls stop_test_run, immediately managing resources and preventing unnecessary billing or service impact.
Comparing scenarios quickly
A Performance Engineer needs to compare two different flows (login vs. checkout). They ask the agent to run both using run_scenario back-to-back, then call list_test_runs and get_test_run for each result in one chat session.
The Tradeoffs
Assuming data consistency
Trying to run a test using a scenario ID that hasn't been verified or listing available browsers without checking the account first.
→
Always check your limits and configurations first. Use get_account to verify runtime VUs, then call list_scenarios to get IDs, before running anything with run_scenario.
Over-relying on summaries
Accepting the general summary from get_test_run and thinking you understand why the throughput dropped.
→
For root cause analysis, skip the summary. Immediately call get_test_run_stats. That raw data shows response times, which is what matters when debugging.
Not knowing current status
Asking for metrics on a run that was never actually started or has already been deleted.
→
Before asking for details, always call list_test_runs. This gives you the list of valid IDs and their current status. Only then can you reliably use get_test_run.
When It Fits, When It Doesn't
Use this MCP Server if your core job involves simulating real-world user traffic, managing complex performance workflows across multiple browsers, or needing raw statistical metrics (throughput, P95) immediately.
Don't use it if you just need to check a single metric manually (use dedicated monitoring tools). If all you need is simple status checking on one run, list_test_runs and get_test_run will suffice. However, if you need the deep numbers—the why behind the performance number—you must use get_test_run_stats. This server handles the whole lifecycle: from auditing infrastructure (get_account) to running the test (run_scenario) and finally diagnosing the failure (get_test_run_stats).
Independent Platform Disclaimer: Vinkius is an independent platform and is not affiliated with, endorsed by, sponsored by, verified by, or otherwise authorized by LoadNinja. All third-party trademarks, logos, and brand names are the property of their respective owners. Their use on this website is strictly for informational purposes to identify service compatibility and interoperability.
VINKIUS INFRASTRUCTURE
Cloud Hosted
Managed infra
V8 Isolated
Sandboxed per request
Zero-Trust Proxy
No stored credentials
DLP Enforced
Policy on every call
GDPR Compliant
EU data residency
Token Compression
~60% cost reduction
Works with Claude, ChatGPT, Cursor, and more
The Model Context Protocol standardizes how applications expose capabilities to LLMs. Instead of operating in isolation, your AI gains direct access to external platforms, live data, and real-world actions through secure, standardized connections.
This server provides 10 capabilities that interface natively with Claude, ChatGPT, Cursor, and any MCP client. No middleware. No custom integration required.
Available Capabilities
Performance testing used to mean dashboard hell.
You know the drill: You have to jump into a web console, select the environment, pick the scenario from a dropdown list, manually input VUs and time limits. Then you wait for it to finish, click through multiple tabs to find the summary metrics, and if you need the raw data, you download a CSV—a process that takes at least five minutes of tedious clicking, copying, and pasting.
Now? You just tell your agent what you want: 'Run the checkout flow with 200 VUs for ten minutes.' The agent handles the console navigation. It runs the test, and when it's done, you don't download anything; you ask for `get_test_run` details right there in chat. You get the result immediately.
Use LoadNinja (Real-Browser Load Testing) MCP Server: run full load simulations from chat.
Before, if you wanted to change a test—say, increase VUs or switch the browser type—you had to log back into the console and find the correct setting. It was slow, risky, and required high permissions just to adjust parameters.
Now, your agent manages it. You use `list_scenarios` to see what exists, then you can call `get_scenario` on a specific ID to pull its config, let your team review it, and then tell the agent to run it with new parameters via `run_scenario`. It's full control, zero friction.
Common Questions About LoadNinja MCP
How do I check my current virtual user limits using get_account? +
Call get_account to retrieve your account details. This tool provides a precise number for your runtime VU limit, letting you know the ceiling before you even start designing the test.
What should I use if I need raw throughput data? Do I use get_test_run or get_test_run_stats? +
You must call get_test_run_stats. While get_test_run gives a good summary, the raw statistics tool provides the granular metrics like request/sec and P95 duration you need for serious debugging.
I started a test but it's going too long. How do I stop it? +
Use stop_test_run. This tool immediately vaporizes the active load test, freeing up resources and preventing unexpected costs or service impacts.
How can I list all my defined performance scenarios? Use list_scenarios. +
Simply call list_scenarios. This pulls every scenario ID available in your account. You then use the specific IDs with get_scenario to see their full configuration details.
What if I want to run a test on a different browser type? Can I list_browsers? +
Yes, call list_browsers. This shows all the native browser variants configured and available in your LoadNinja account for testing.
How do I actually start a load test run with my desired VUs and duration using `run_scenario`? +
You use run_scenario. This tool takes the scenario ID, target virtual users (VUs), and the run duration in minutes. It immediately triggers the high-traffic simulation on LoadNinja.
Before I build a complex test, how can I check all available data center locations using `list_locations`? +
list_locations provides a list of every physical data center where you can inject load. This is crucial for auditing global scalability and ensuring regional coverage.
What's the best way to see if multiple test runs—active or completed—have finished using `list_test_runs`? +
Use list_test_runs. This tool gathers all your test execution records, letting you check the status and IDs of both active tests and historical completions.
What is unique about LoadNinja's approach to load testing? +
Unlike protocol-based tools, LoadNinja uses actual real browsers at scale. Your agent can trigger scenarios that execute scripts inside native browsers, ensuring your performance metrics accurately reflect the true end-user experience including client-side execution.
Can I stop a running test through my agent if I see performance degradation? +
Yes. Use the stop_test_run tool with the active Run ID. Your agent will dispatch an immediate halt command to LoadNinja, stopping all physical load processes and allowing you to analyze the metrics captured up to that point.
How do I check my account's virtual user (VU) limits? +
The get_account tool retrieves your subscription details and strict runtime VU limits. Your agent will report your current usage caps, ensuring you stay within your performance testing budget.
Use it with your favorite AI tools
Connect this server to Cursor, Claude, VS Code, and more.
More in this category

Knack
Manage your Knack database — list objects, query records, and perform CRUD operations via natural language.

Levenshtein Distance Engine
Calculate the exact edit distance between two strings. Essential for fuzzy matching, spell checking, and deduplication. Stop LLMs from guessing string similarity.
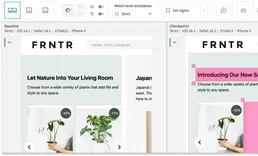
Applitools
Bring AI-powered visual testing to your AI agent — inspect test batches, review UI diffs, and manage your visual baselines naturally.
You might also like

TheFork
Discover, book, and manage restaurant reservations across Europe — search by location, cuisine, and availability through natural AI conversation.

Nifty
Combine tasks, timelines, docs, and chat in one project management workspace that replaces multiple tools at once.

String
Engage mobile app users with targeted push notifications, in-app messages, and behavioral triggers that improve retention.