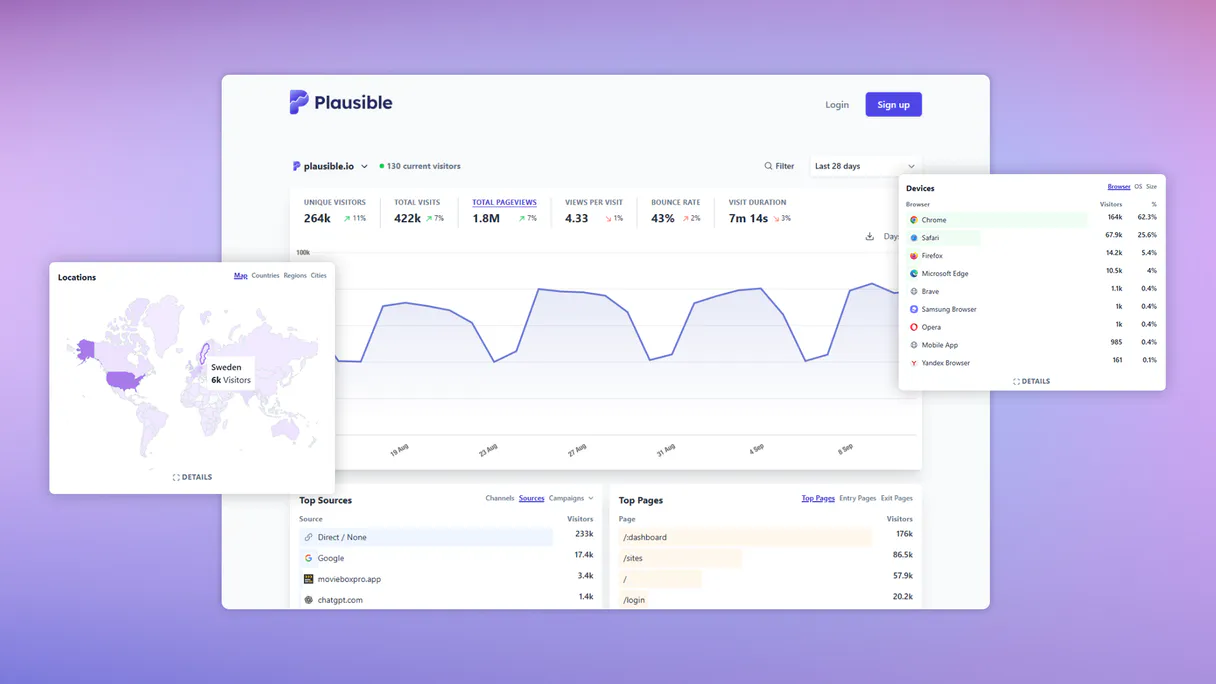
Plausible MCP. Get web analytics answers from plain conversation.
 Gemini
 Works with every AI agent you already use
…and any MCP-compatible client
Just plug in your AI agents and start using Vinkius.
Plausible connects your website analytics directly to any AI agent. You ask questions in plain English—like 'What was my bounce rate last week?'—and it runs specialized tools like `get_aggregate_stats` to pull real-time data on visitors, pageviews, and traffic sources.
It's cookieless web performance monitoring built for your chat interface.
What your AI agents can do
Get aggregate stats
Fetches overall site statistics, including total visitors, pageviews, and bounce rates for a specified period (e.g., '30d').
Get custom breakdown
Retrieves metrics broken down by any specific custom property supported by Plausible.
Get realtime visitors
Provides the current number of people who are actively viewing your site right now.
Runs get_realtime_visitors to get an exact count of people currently on your website.
Uses get_aggregate_stats to retrieve total visitor counts, pageviews, and bounce rates for defined periods (e.g., '7d' or '30d').
Runs get_custom_breakdown to break down stats based on specific visitor properties like referral sources or event pages.
Calls get_timeseries_stats to see how your traffic volume has changed over a set number of days, visualizing the trend.
Uses specialized tools—like get_top_countries, get_top_devices, or get_top_os—to segment your audience by location, hardware, and OS.
Ask AI about this MCP
Supported MCP Clients
Gemini Waiting for input…
Plausible MCP Server: 10 Tools for Web Analytics
Run any web analytics query—from checking live visitor counts to analyzing top traffic sources—using these ten specialized tools.
019d75f7get aggregate stats
Fetches overall site statistics, including total visitors, pageviews, and bounce rates for a specified period (e.g., '30d').
019d75f7get custom breakdown
Retrieves metrics broken down by any specific custom property supported by Plausible.
019d75f7get realtime visitors
Provides the current number of people who are actively viewing your site right now.
019d75f7get timeseries stats
Generates a time series of site statistics to show traffic trends over multiple days or weeks.
019d75f7get top browsers
Identifies and lists the browser types that your visitors are using most often.
019d75f7get top countries
Lists the top geographical countries where your website is receiving traffic.
019d75f7get top devices
Shows which types of physical devices (desktop, mobile, tablet) are visiting your site most frequently.
019d75f7get top os
Details the operating systems used by visitors (e.g., iOS, Windows, Android).
019d75f7get top pages
Retrieves a list of the pages that are being visited most often.
019d75f7get top sources
Identifies and ranks the top sources (like Google, Twitter, or direct entry) sending traffic to your site.
Choose How to Get Started
Build a custom MCP for your own tools, or connect a ready-made integration from our catalog.
Build Your Own
Turn any API into an MCP. Import a spec, define Agent Skills, or deploy with MCPFusion.
- Import from OpenAPI, Swagger, or YAML specs
- Create Agent Skills with progressive disclosure
- Deploy to edge with MCPFusion framework
- Built in DLP, auth, and compliance on every call
- Real time usage dashboard and cost metering
- Publish to catalog or keep private
Make Your AI Do More
Start with Plausible, then connect any of our 4,700+ other servers whenever your AI needs more. One click, no limits.
- Use this MCP plus 4,700+ others, all in one place
- Add new capabilities to your AI anytime you want
- Every connection is secured and compliant automatically
- Track usage and costs across all your servers
- Works with Claude, ChatGPT, Cursor, and more
- New servers added to the catalog every week
What you can do with this MCP connector
You connect Plausible directly to your AI agent, giving you full control over your site metrics through plain English conversation. Forget jumping between dashboards and digging through reports; just ask what you need.
This server lets your AI client pull detailed web performance data right into the chat window. You don't gotta know any API structure—you just talk to it, and the agent runs specialized tools like get_aggregate_stats or get_top_sources to get the answers you want.
Real-Time Activity Monitoring
Your AI client can immediately check current site activity using get_realtime_visitors, giving you an exact count of people viewing your website right now. For a deeper look at how traffic has moved, it uses get_timeseries_stats to generate a historical series of data, letting you track volume changes over weeks or days.
Analyzing Core Performance Metrics
When you want to analyze general site performance, the agent runs get_aggregate_stats. This tool fetches overall statistics for any defined period—say, '7d' or '30d'—giving you total visitor counts, pageviews, and bounce rates. You can drill down further by running get_custom_breakdown, which pulls metrics broken down based on specific properties supported by Plausible, like a particular referral source or an event page.
Understanding Visitor Demographics
The agent uses specialized tools to segment your audience across multiple dimensions. To see who’s visiting you, it runs get_top_countries, listing the top geographical locations sending traffic. For hardware breakdowns, it checks which types of devices—desktop, mobile, or tablet—are hitting your site most often via get_top_devices. The agent also details visitor operating systems with get_top_os (e.g., iOS, Android, Windows) and identifies the browser types using get_top_browsers.
Pinpointing Traffic Flow
When you need to know where your traffic is coming from, the agent uses get_top_sources, which ranks top sources like Google or Twitter. It also tells you which pages are drawing the most attention by running get_top_pages and identifying the top referring sites with get_top_sources. The system can even break down all this data further based on specific visitor properties using get_custom_breakdown, allowing you to filter stats by things like referral sources or event pages.
These tools work together so you get a complete picture of who's visiting, what they're looking at, and where they came from.
How Plausible MCP Works
- 1 Subscribe to the server and input your Plausible Site ID and API Key.
- 2 Ask your agent a specific question about site metrics (e.g., 'Show me top traffic sources for last month').
- 3 The agent triggers the relevant tool, fetching the data which is then returned as clean text in the chat.
The bottom line is: you talk to your AI client and it talks to Plausible, giving you answers without leaving the chat window.
Who Is Plausible MCP For?
Website owners who spend too much time clicking through multiple analytics dashboards. Digital marketers needing immediate performance checks during campaign reviews. Product managers trying to audit feature adoption rates and user behavior trends.
Uses get_top_sources and get_aggregate_stats to quickly review which campaigns are driving the most qualified traffic and how those visitors behave.
Runs get_custom_breakdown or get_top_pages to audit user behavior, seeing if users hit a specific feature page after landing on the homepage.
Checks system health and general performance by calling get_realtime_visitors or running historical checks with get_timeseries_stats.
What Changes When You Connect
- Instantly check live activity with
get_realtime_visitors. You don't have to wait for a dashboard refresh; you just ask, and the answer drops immediately. - Review your site’s health over time. Use
get_timeseries_statsto see if traffic is trending up or down across 30 days, making seasonal dips obvious at a glance. - Understand who is visiting. Running
get_top_countriesandget_top_deviceshelps you tailor content for specific regions or mobile users. - Pinpoint your marketing success. Use
get_top_sourcesto see exactly which referral channels are sending the most visitors, helping you justify ad spend. - Deep dive into user paths. Tools like
get_top_pagesandget_custom_breakdownlet you see if users bounce after landing on a specific page or feature.
Real-World Use Cases
Campaign performance review
A marketer needs to know which campaign is working. Instead of filtering reports in the analytics tool, they prompt their agent: 'Show me top sources and aggregate stats for last 7 days.' The agent calls get_top_sources and get_aggregate_stats, giving them a single report that immediately highlights successful campaigns.
Debugging slow adoption
A PM notices few people use the new 'Contact' page. They ask: 'What are my top pages and what is my bounce rate?' The agent runs get_top_pages and then get_aggregate_stats. Seeing high traffic to a page, but also a high bounce rate, tells the PM the content needs work.
Analyzing device bias
A web owner suspects their site looks bad on mobile. They ask: 'What are my top devices and what is the operating system breakdown?' The agent uses get_top_devices and get_top_os, confirming that 80% of traffic comes from older Android phones, directing development efforts.
Checking real-time site health
An ops engineer gets a sudden dip in traffic. They immediately ask: 'How many visitors are on the site right now?' The agent calls get_realtime_visitors, giving them an instant count and letting them know if the drop is gradual or catastrophic.
The Tradeoffs
Asking vague questions
Typing: 'Tell me about my traffic.' This gives you zero data. The agent doesn't know what time period, metric, or source you care about.
→
Be specific and use the tools directly. Instead of a vague query, ask for get_aggregate_stats for '30d' AND then follow up with get_top_sources. Specificity is key.
Ignoring time periods
Asking: 'What are my top pages?' without specifying a date range. The tool defaults to something useless, or worse, fails.
→
Always include a period. Ask for get_top_pages for the 'last 7 days'. This forces the agent to use time-gated tools like get_aggregate_stats.
Mixing up metrics
Asking: 'How many people are using Chrome and coming from Google?' The server might not be able to correlate those two specific filters in one go.
→
Break it down. First, check the source with get_top_sources. Second, use get_custom_breakdown targeting both 'browser' AND 'source' if that property is available.
When It Fits, When It Doesn't
Use this server if your absolute priority is cookieless analytics and conversational data retrieval. If you need to monitor website performance without relying on third-party cookies, Plausible handles it natively.
Don't use this if:
* You require highly complex, custom database joins outside of standard web metrics (e.g., correlating user behavior with internal CRM records). In that case, a dedicated data warehouse connection is better.
* Your primary goal is general marketing automation or workflow management. For those tasks, you'll need tools focused on messaging or task execution, not just reading stats. You still need to use this for the 'source of truth' web metrics, though.
Independent Platform Disclaimer: Vinkius is an independent platform and is not affiliated with, endorsed by, sponsored by, verified by, or otherwise authorized by Plausible. All third-party trademarks, logos, and brand names are the property of their respective owners. Their use on this website is strictly for informational purposes to identify service compatibility and interoperability.
VINKIUS INFRASTRUCTURE
Cloud Hosted
Managed infra
V8 Isolated
Sandboxed per request
Zero-Trust Proxy
No stored credentials
DLP Enforced
Policy on every call
GDPR Compliant
EU data residency
Token Compression
~60% cost reduction
Works with Claude, ChatGPT, Cursor, and more
The Model Context Protocol standardizes how applications expose capabilities to LLMs. Instead of operating in isolation, your AI gains direct access to external platforms, live data, and real-world actions through secure, standardized connections.
This server provides 10 capabilities that interface natively with Claude, ChatGPT, Cursor, and any MCP client. No middleware. No custom integration required.
Available Capabilities
Diving into dashboards isn't analytics; it's a time sink.
Today, checking campaign performance means clicking from Google Analytics to your ad platform, then switching back to the website dashboard. You filter by date, you click on 'Source,' and then you have to manually cross-reference bounce rates versus total pageviews. It takes five minutes of clicks and mental juggling just to get a basic picture.
With this Plausible MCP Server, that process vanishes. You simply ask your agent: 'Show me the aggregate stats for last 30 days.' The server runs `get_aggregate_stats` and delivers the total visitors, bounce rates, and pageviews in one clear response. No clicks required.
Plausible MCP Server: Get site metrics from chat.
Manual checking involves pulling a report for top pages, opening another tab to check the source breakdown, and then running a third query just to see device usage. It's slow, fragmented, and you always lose context between tabs.
Now, your agent handles it all. You ask about traffic trends, and the server orchestrates multiple tools—like `get_top_sources` and `get_timeseries_stats`—in sequence to build a complete answer for you. The whole process is one question, one answer.
Common Questions About Plausible MCP
How do I check my bounce rate with get_aggregate_stats? +
You ask your agent: 'What was the aggregate bounce rate for 30d?'. The tool calls get_aggregate_stats and pulls that specific metric from Plausible's data.
Can I find out my top traffic sources using get_top_sources? +
Yes. Just ask the agent to run get_top_sources. It immediately lists all your primary referral channels, letting you know exactly where your visitors are coming from.
Is Plausible MCP Server good for mobile vs desktop users? +
Yes. You can use get_top_devices or get_top_os. These tools break down the data so you know exactly what kind of machine your visitors are using.
How do I see traffic trends over time with get_timeseries_stats? +
You prompt the agent to run get_timeseries_stats. It gives you a historical view, letting you track if your traffic volume is increasing or dipping week over week.
How do I run a granular analysis by specific properties using get_custom_breakdown? +
You can segment data by custom properties. This tool allows you to break down site metrics not just by country or device, but by any specialized attribute you've configured in Plausible. Use this when standard reports don't capture the exact user journey detail you need.
Is the data from get_realtime_visitors delayed, or is it immediate? +
The data provided by get_realtime_visitors reflects current activity with minimal latency. It gives you a near-instantaneous count of active users on your site right now, making it useful for live event monitoring and quick checks.
Can I filter my traffic report to see only visitors from specific regions using get_top_countries? +
Yes, you can narrow down your audience analysis by country. get_top_countries lets you focus on geographical performance, so you don't have to sift through global data to understand where your key markets are coming from.
What is the best way to audit my content using get_top_pages? +
Use get_top_pages to identify which specific pages drive the most traffic. This tool helps you quickly spot your highest-performing content, allowing you to understand where visitors are spending their time and what needs promotion.
How do I find my Plausible API Key? +
In your Plausible account, go to Settings > API keys. There you can generate and copy your access token.
What is the Site ID? +
The Site ID is usually the domain of your website as registered in Plausible (e.g., example.com).
Can I see stats for today only? +
Yes! Use the get_aggregate_stats tool and provide day as the period parameter.
Use it with your favorite AI tools
Connect this server to Cursor, Claude, VS Code, and more.
More in this category

Faker
Generate high-quality mock data for development and testing — including addresses, persons, companies, and products in multiple locales.

Omni BI Intelligence
Interact with Omni BI dashboards, models, and data exports — run queries and track metrics directly from your AI agent.

BCB Inflação — IPCA, IGP-M, INPC e Expectativas
Brazilian inflation indices: IPCA (official CPI), IPCA-15 (advance reading), IGP-M (rent and contract index), INPC (minimum wage index), and Focus Survey market expectations for future inflation from Brazil's Central Bank.
You might also like

Contentstack
Manage headless CMS via Contentstack — list and create entries, audit content types, handle media assets, and publish to environments directly from any AI agent.

YAML Parser Engine
Convert YAML to JSON and JSON to YAML with absolute precision — including anchors, aliases, and multi-document support. The engine behind Kubernetes, GitHub Actions, and Docker Compose config processing. 30M+ weekly downloads.

Species
Access the GBIF Backbone Taxonomy to search, match, and explore species data, hierarchies, and biological media directly from your AI agent.