TestMonitor MCP Server for Windsurf 10 tools — connect in under 2 minutes
Windsurf brings agentic AI coding to a purpose-built IDE. Connect TestMonitor through Vinkius and Cascade will auto-discover every tool. ask questions, generate code, and act on live data without leaving your editor.
ASK AI ABOUT THIS MCP SERVER
Vinkius supports streamable HTTP and SSE.
Vinkius Desktop App
The modern way to manage MCP Servers — no config files, no terminal commands. Install TestMonitor and 2,500+ MCP Servers from a single visual interface.


{
  "mcpServers": {
    "testmonitor": {
      "url": "https://edge.vinkius.com/[YOUR_TOKEN_HERE]/mcp"
    }
  }
}
* Every MCP server runs on Vinkius-managed infrastructure inside AWS - a purpose-built runtime with per-request V8 isolates, Ed25519 signed audit chains, and sub-40ms cold starts optimized for native MCP execution. See our infrastructure
About TestMonitor MCP Server
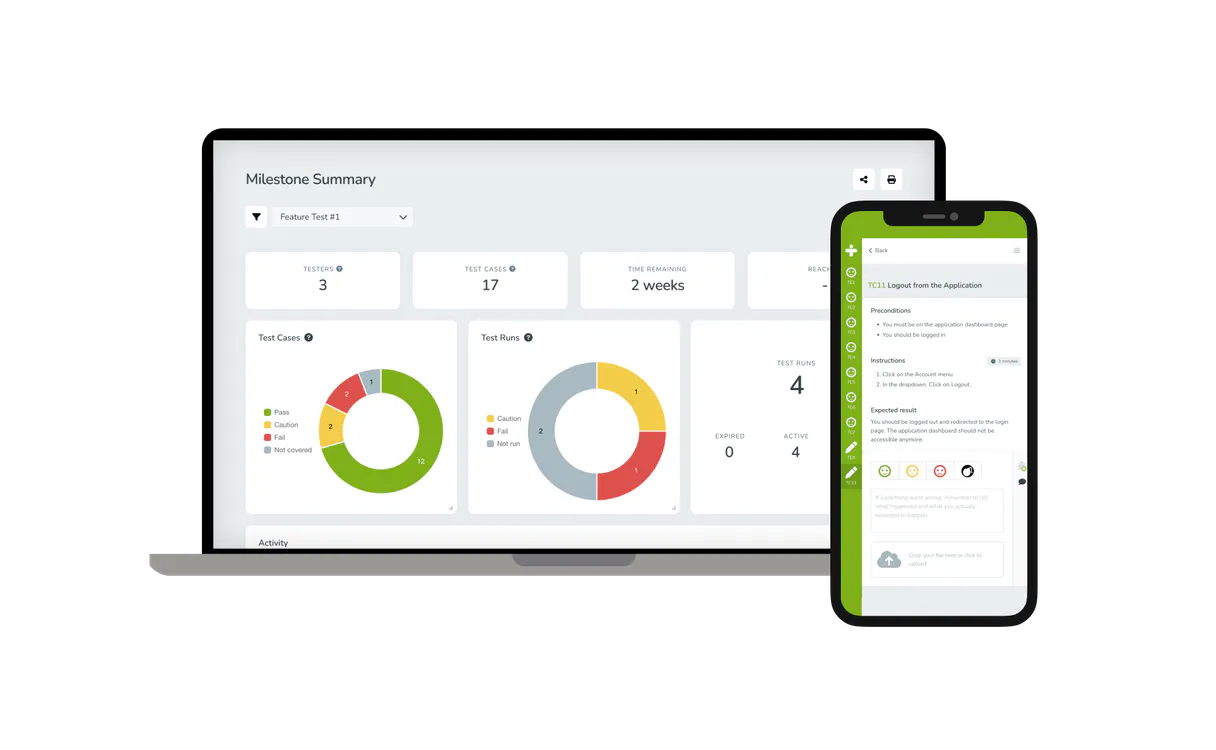
Link up your TestMonitor cloud infrastructure with any AI agent to streamline QA tracking operations and retrieve real-time milestone data without having to navigate web dashboards.
Windsurf's Cascade agent chains multiple TestMonitor tool calls autonomously. query data, analyze results, and generate code in a single agentic session. Paste Vinkius Edge URL, reload, and all 10 tools are immediately available. Real-time tool feedback appears inline, so you see API responses directly in your editor.
What you can do
- Project Triage — List all ongoing projects alongside their high-level metadata such as test coverage and delivery status
- Runs & Milestones Tracking — Instantly retrieve project-scoped test runs, milestones lists, and deadline progress
- Defect Auditing — Query all generated issues or software defects explicitly linked to a specific test project
- Requirement Tracing — Ask the agent to map requirements against existing feature specifications without manually matching them in the UI
- Team Management Lookup — Easily list out all the users provisioned in the workspace to confirm roles or debugging ownership
The TestMonitor MCP Server exposes 10 tools through the Vinkius. Connect it to Windsurf in under two minutes — no API keys to rotate, no infrastructure to provision, no vendor lock-in. Your configuration, your data, your control.
How to Connect TestMonitor to Windsurf via MCP
Follow these steps to integrate the TestMonitor MCP Server with Windsurf.
Open MCP Settings
Go to Settings → MCP Configuration or press Cmd+Shift+P and search "MCP"
Add the server
Paste the JSON configuration above into mcp_config.json
Save and reload
Windsurf will detect the new server automatically
Start using TestMonitor
Open Cascade and ask: "Using TestMonitor, help me...". 10 tools available
Why Use Windsurf with the TestMonitor MCP Server
Windsurf provides unique advantages when paired with TestMonitor through the Model Context Protocol.
Windsurf's Cascade agent autonomously chains multiple tool calls in sequence, solving complex multi-step tasks without manual intervention
Purpose-built for agentic workflows. Cascade understands context across your entire codebase and integrates MCP tools natively
JSON-based configuration means zero code changes: paste a URL, reload, and all 10 tools are immediately available
Real-time tool feedback is displayed inline, so you see API responses directly in your editor without switching contexts
TestMonitor + Windsurf Use Cases
Practical scenarios where Windsurf combined with the TestMonitor MCP Server delivers measurable value.
Automated code generation: ask Cascade to fetch data from TestMonitor and generate models, types, or handlers based on real API responses
Live debugging: query TestMonitor tools mid-session to inspect production data while debugging without leaving the editor
Documentation generation: pull schema information from TestMonitor and have Cascade generate comprehensive API docs automatically
Rapid prototyping: combine TestMonitor data with Cascade's code generation to scaffold entire features in minutes
TestMonitor MCP Tools for Windsurf (10)
These 10 tools become available when you connect TestMonitor to Windsurf via MCP:
get_project_details
Retrieves details for a specific TestMonitor project
get_test_case_details
Retrieves full details for a specific TestMonitor test case
get_test_run_details
Retrieves details for a specific TestMonitor test run
list_account_users
Lists all users associated with the TestMonitor account
list_issues
Lists all issues (defects) within a project
list_milestones
Lists all milestones within a project
list_projects
Project IDs are required for most other tools. Lists all projects available on the TestMonitor instance
list_requirements
Lists all requirements for a project
list_test_cases
Lists all test cases within a specific TestMonitor project
list_test_runs
Lists all test runs within a specific project
Example Prompts for TestMonitor in Windsurf
Ready-to-use prompts you can give your Windsurf agent to start working with TestMonitor immediately.
"List all TestMonitor projects."
"Get me the details for Test Case ID 5521 from project 8840."
"List all issues for Project 8840."
Troubleshooting TestMonitor MCP Server with Windsurf
Common issues when connecting TestMonitor to Windsurf through the Vinkius, and how to resolve them.
Server not connecting
TestMonitor + Windsurf FAQ
Common questions about integrating TestMonitor MCP Server with Windsurf.
How does Windsurf discover MCP tools?
mcp_config.json file on startup and connects to each configured server via Streamable HTTP. Tools are listed in the MCP panel and available to Cascade automatically.Can Cascade chain multiple MCP tool calls?
Does Windsurf support multiple MCP servers?
mcp_config.json. Each server's tools appear in the MCP panel and Cascade can use tools from different servers in a single flow.Connect TestMonitor with your favorite client
Step-by-step setup guides for every MCP-compatible client and framework:
Anthropic's native desktop app for Claude with built-in MCP support.
AI-first code editor with integrated LLM-powered coding assistance.
GitHub Copilot in VS Code with Agent mode and MCP support.
Purpose-built IDE for agentic AI coding workflows.
Autonomous AI coding agent that runs inside VS Code.
Anthropic's agentic CLI for terminal-first development.
Python SDK for building production-grade OpenAI agent workflows.
Google's framework for building production AI agents.
Type-safe agent development for Python with first-class MCP support.
TypeScript toolkit for building AI-powered web applications.
TypeScript-native agent framework for modern web stacks.
Python framework for orchestrating collaborative AI agent crews.
Leading Python framework for composable LLM applications.
Data-aware AI agent framework for structured and unstructured sources.
Microsoft's framework for multi-agent collaborative conversations.
Connect TestMonitor to Windsurf
Get your token, paste the configuration, and start using 10 tools in under 2 minutes. No API key management needed.