AEMO Energy MCP. Model Australian power prices and emissions.
 Gemini
 Works with every AI agent you already use
…and any MCP-compatible client
Just plug in your AI agents and start using Vinkius.
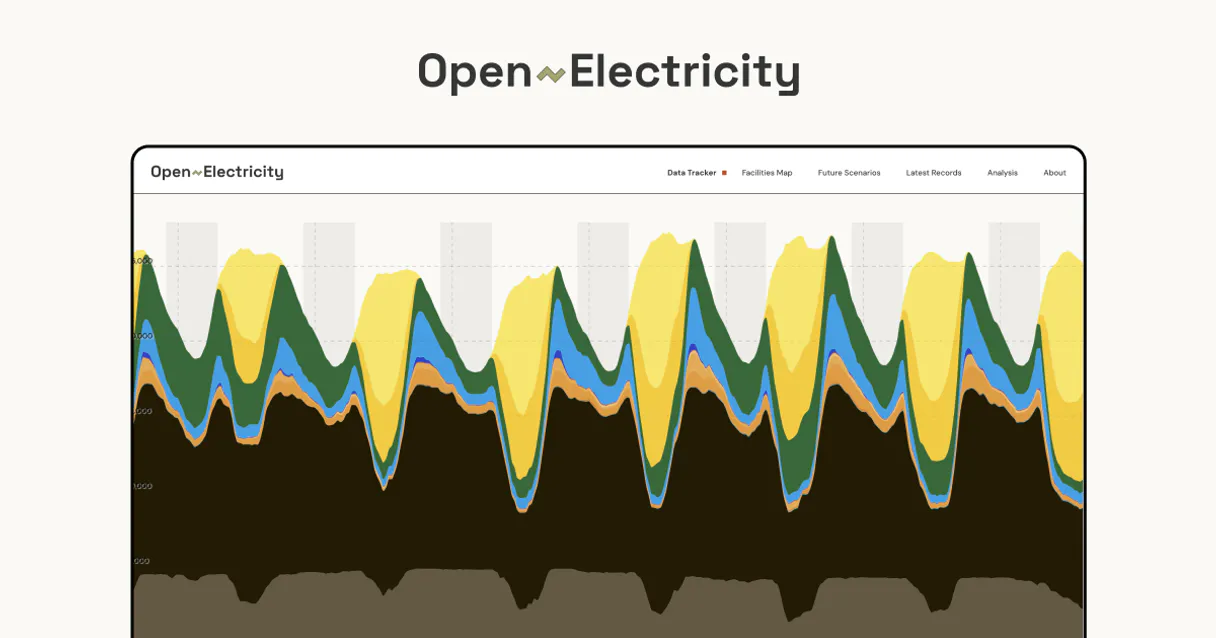
AEMO Australian Energy MCP Server accesses the OpenElectricity API, giving your AI client real-time Australian energy market intelligence. It lets you retrieve spot prices, track power generation by fuel (coal, wind, solar, gas), monitor regional demand, and analyze emissions data across the National Electricity Market (NEM).
Use it to model energy transitions or optimize solar self-consumption.
What your AI agents can do
Get facility data
Retrieves generation output data for a specific, named energy facility.
Get market data
Fetches market data, including spot prices and demand, with filtering by region and date range.
Get market updates
Pulls recent market commentary and social posts directly from OpenElectricity.
Retrieves real-time and historical wholesale electricity prices (RRP) for specific Australian regions.
Gets network generation data, breaking down total power output by fuel type (wind, solar, coal, gas, etc.).
Monitors electricity demand across the NEM using various time granularities, from 5 minutes to months.
Queries pollution and emissions data, including NOx, SO2, and CO, from the National Pollutant Inventory.
Retrieves generation output, status, and capacity details for specific power stations or solar/wind farms.
Gathers time-series data and metrics, allowing comparison of power generation and demand across Australian states.
Ask AI about this MCP
Supported MCP Clients
Gemini Waiting for input…
AEMO Australian Energy: 12 Tools for Market Analysis
These tools let you query specific components of the Australian energy grid, from wholesale pricing to pollutant emissions, giving you granular control over your data calls.
019d7548get facility data
Retrieves generation output data for a specific, named energy facility.
019d7548get market data
Fetches market data, including spot prices and demand, with filtering by region and date range.
019d7548get market updates
Pulls recent market commentary and social posts directly from OpenElectricity.
019d7548get network by fueltech
Gathers network data grouped by the type of fuel used (e.g., coal, wind, solar, gas).
019d7548get network by region
Retrieves time-series network data grouped by specific Australian state or region.
019d7548get network data
Gets general time-series network data for power, energy, and demand, supporting various time aggregations.
019d7548get plans
Lists the available API subscription tiers and associated pricing information.
019d7548get pollution data
Gets pollution and emissions data from the National Pollutant Inventory (NPI) for energy facilities.
019d7548get renewable proportion
Calculates and retrieves the real-time percentage of electricity generated from renewable sources.
019d7548get user profile
Checks your current API account details, including rate limits and usage statistics.
019d7548list facilities
Lists all energy generation facilities, allowing filtering by fuel type, status, or network code.
019d7548list metrics
Lists every single metric name available in the OpenElectricity API for querying.
Choose How to Get Started
Build a custom MCP for your own tools, or connect a ready-made integration from our catalog.
Build Your Own
Turn any API into an MCP. Import a spec, define Agent Skills, or deploy with MCPFusion.
- Import from OpenAPI, Swagger, or YAML specs
- Create Agent Skills with progressive disclosure
- Deploy to edge with MCPFusion framework
- Built in DLP, auth, and compliance on every call
- Real time usage dashboard and cost metering
- Publish to catalog or keep private
Make Your AI Do More
Start with AEMO Australian Energy, then connect any of our 4,700+ other servers whenever your AI needs more. One click, no limits.
- Use this MCP plus 4,700+ others, all in one place
- Add new capabilities to your AI anytime you want
- Every connection is secured and compliant automatically
- Track usage and costs across all your servers
- Works with Claude, ChatGPT, Cursor, and more
- New servers added to the catalog every week
What you can do with this MCP connector
Your AI client plugs into the OpenElectricity API, giving you deep market intel on Australian energy. You can track everything from spot prices to how much power's coming from wind or coal. Here's what you can do.
get_market_data: You can pull real-time and historical wholesale electricity prices (RRP) for specific Australian regions by filtering for a date range and region.
get_network_data: This tool grabs general time-series network data for power, energy, and demand, and it supports multiple time aggregations.
get_market_updates: You can pull recent market commentary and social posts straight from OpenElectricity.
get_pollution_data: You get pollution and emissions data from the National Pollutant Inventory (NPI) for energy facilities, tracking things like NOx, SO2, and CO.
get_renewable_proportion: It calculates and pulls the real-time percentage of electricity generated by renewable sources.
get_facility_data: This fetches generation output data for any specific, named energy facility.
list_facilities: You can list all energy generation facilities, and you can even filter them by fuel type, status, or network code.
list_metrics: This lists every metric name available in the OpenElectricity API, so you know exactly what you can query.
get_network_by_fueltech: You gather network data grouped by the type of fuel used—think coal, wind, solar, or gas.
get_network_by_region: It retrieves time-series network data grouped by specific Australian state or region.
get_plans: You check the available API subscription tiers and their associated pricing.
get_user_profile: You check your current API account details, including your rate limits and usage stats.
How AEMO Energy MCP Works
- 1 Subscribe to the server and provide your OpenElectricity API Bearer token to your AI client.
- 2 Tell your AI client the specific data point you need (e.g., 'Show the pollution levels in VIC for SO2 in 2023').
- 3 The agent uses the appropriate tool (e.g.,
get_pollution_data) to fetch the data, and the client delivers the structured, actionable report.
The bottom line is that your AI client becomes an immediate Australian energy data analyst, letting you run complex market queries without writing API code.
Who Is AEMO Energy MCP For?
This is for the energy analyst who needs to generate market reports on the fly, the sustainability manager tracking carbon compliance, or the researcher studying grid resilience. You're done clicking through dashboards; you need specific, cross-domain data correlation.
Uses get_market_data to fetch spot prices and get_network_by_region to compare market performance across NSW, VIC, and QLD.
Runs get_pollution_data and get_renewable_proportion to create mandatory environmental compliance reports.
Checks get_network_by_fueltech to track the state of the energy transition and forecast renewable adoption rates.
Queries the API to find when wholesale prices are low and renewable proportion is high, optimizing when to run high-consumption appliances.
What Changes When You Connect
- Track the energy mix in real-time. Use
get_renewable_proportionto see what percentage of Australia’s electricity comes from renewables, which is essential for sustainability reporting. - Compare market performance across states.
get_network_by_regionlets you compare power generation and demand data between NSW, VIC, and QLD in one query. - Analyze historical pricing.
get_market_datapulls historical spot prices and demand, letting you model price fluctuations over months or years. - Understand environmental compliance. Running
get_pollution_datagives you specific emissions metrics (NOx, SO2, CO) required for regulatory reporting. - Track specific assets.
get_facility_datalets you monitor the actual output of a single wind or solar farm, useful for operational risk assessment. - Optimize personal use. Query the data to find periods where prices are low and the renewable proportion is high, helping you time EV charging or solar usage.
Real-World Use Cases
Forecasting Peak Grid Stress
A utility planner needs to know if the grid can handle peak demand in QLD. They prompt their agent: 'Analyze the projected peak demand using get_network_data and cross-reference it with current coal generation using get_network_by_fueltech.' The agent runs both tools and delivers a report on potential generation deficits.
Assessing Carbon Footprint
A sustainability team must report on carbon emissions for the last quarter. They ask the agent to run get_pollution_data and then use get_renewable_proportion to quantify the shift away from high-emission sources. The agent compiles the total impact data.
Modeling Solar Duck Curve
A homeowner wants to know the best time to charge their EV. They prompt: 'Show me NEM spot prices and renewable proportion for the next 24 hours.' The agent uses get_market_data and get_renewable_proportion to identify negative pricing windows.
Evaluating Market Volatility
A financial analyst needs to see how volatile the market was last year. They instruct the agent to use get_market_data with historical date range filtering, comparing RRP to the average of the same period last year.
The Tradeoffs
Asking for 'all energy data'
Asking the agent, 'Give me everything about Australian energy.' This results in a massive, unfilterable dump of data from all 12 tools, leaving the user nowhere to start.
→
Start with a narrow goal. If you need market pricing, use get_market_data first. If you need emissions, use get_pollution_data. Always specify the region and time period.
Confusing generation data
Running both get_network_data and get_network_by_region for the same period. They return overlapping, redundant time-series data that just clutters the output without adding new insight.
→
If you need a general time series, use get_network_data. If you need to compare state-specific trends, use get_network_by_region and specify the states you care about.
Ignoring the user's status
Attempting to run complex queries without checking rate limits. The query fails with a generic 'API limit reached' error, wasting time and context.
→
Always run get_user_profile first. This confirms your current rate limits and API plan before you run a resource-heavy query.
When It Fits, When It Doesn't
Use this if your objective requires correlating three or more distinct data types: market price, fuel source mix, and environmental metrics. For example, 'How does high coal generation correlate with pollution spikes?' If you only need a simple comparison (e.g., 'What was the spot price in NSW last week?'), then get_market_data is enough. If you only care about the environmental impact, get_pollution_data works alone. Never use this if you just need basic market news; use get_market_updates instead. If you're unsure which data points to combine, run list_metrics first to see all available fields.
Independent Platform Disclaimer: Vinkius is an independent platform and is not affiliated with, endorsed by, sponsored by, verified by, or otherwise authorized by OpenElectricity (OpenNEM). All third-party trademarks, logos, and brand names are the property of their respective owners. Their use on this website is strictly for informational purposes to identify service compatibility and interoperability.
VINKIUS INFRASTRUCTURE
Cloud Hosted
Managed infra
V8 Isolated
Sandboxed per request
Zero-Trust Proxy
No stored credentials
DLP Enforced
Policy on every call
GDPR Compliant
EU data residency
Token Compression
~60% cost reduction
Works with Claude, ChatGPT, Cursor, and more
The Model Context Protocol standardizes how applications expose capabilities to LLMs. Instead of operating in isolation, your AI gains direct access to external platforms, live data, and real-world actions through secure, standardized connections.
This server provides 12 capabilities that interface natively with Claude, ChatGPT, Cursor, and any MCP client. No middleware. No custom integration required.
Available Capabilities
Analyzing Australian power prices used to feel like a multi-day job.
Before this server, compiling a full market report meant navigating dozens of specialized government and industry dashboards. You'd spend hours manually cross-referencing spot prices from one site, generation mixes from another, and pollution metrics from a third. Copying and pasting this data into a spreadsheet to spot trends was a full-time job.
Now, you just ask your agent. It uses `get_market_data` and `get_network_by_region` to pull the exact regional price points and demand curves you need. The agent gives you a single, structured output that instantly shows the trends, letting you skip the data wrangling.
AEMO Energy MCP Server: Get real-time data with get_renewable_proportion.
Before, tracking the true proportion of renewables was a manual calculation, often relying on outdated press releases or partial data sets. You had to combine data on wind output, solar capacity, and hydro generation and then calculate the percentage yourself.
Now, your AI client runs `get_renewable_proportion`. It delivers the current, accurate percentage directly. It's a single function call that gives you the key metric, period.
Common Questions About AEMO Energy MCP
How do I check the current electricity spot price across all Australian states using get_market_data? +
+
Use get_market_data and specify 'spot price' in your request. This tool fetches the real-time and historical wholesale electricity prices (RRP) across regions like NSW, VIC, QLD, etc.
What is the difference between get_network_data and get_network_by_region? +
+
Use get_network_data for general, aggregated time-series data for the entire NEM. Use get_network_by_region when you need to compare or focus on specific state-level trends (e.g., just TAS or SA).
Can I find out the pollution levels for a specific facility using get_pollution_data? +
+
Yes. get_pollution_data lets you filter by facility name, pollutant type (like SO2), or category, pulling required data from the National Pollutant Inventory.
How do I track the percentage of renewable energy using get_renewable_proportion? +
+
Call get_renewable_proportion directly. It gives you the current, real-time percentage of Australia's electricity generated from renewable sources.
What Australian regions/states are covered in the NEM data? +
The National Electricity Market (NEM) covers five regions: New South Wales (NSW1), Victoria (VIC1), Queensland (QLD1), South Australia (SA1), and Tasmania (TAS1). The API also supports the Wholesale Electricity Market (WEM) for Western Australia. Data is available at both the national aggregate level and broken down by individual region.
How do I get an API token for OpenElectricity? +
Visit the OpenElectricity developer portal at https://openelectricity.org.au/content/developers and sign up for a free Community plan. You'll receive a Bearer token that you can paste into the credential field. The Community plan provides generous rate limits suitable for individual use and research. Higher-tier plans (Pro, Academic, Enterprise) are available for commercial applications.
Can I track the percentage of renewable energy in real-time? +
Yes! Use the get_renewable_proportion tool to fetch the current percentage of electricity generation coming from renewable sources (solar, wind, hydro, battery) versus fossil fuels (coal, gas). You can query this at 5-minute intervals for live tracking, or aggregate to hourly, daily, or monthly views. The get_network_by_fueltech tool also provides a detailed breakdown showing each technology's contribution separately.
What time intervals are available for querying historical data? +
The API supports multiple time granularities: 5m (5-minute intervals, most granular), 1h (hourly), 1d (daily), 7d (weekly), 1M (monthly), 3M (quarterly), 1y (yearly), season (seasonal aggregation), and fy (financial year). You can specify date ranges using date_start and date_end parameters in ISO format. Historical data extends back several years for most metrics.
Use it with your favorite AI tools
Connect this server to Cursor, Claude, VS Code, and more.
More in this category

Ambee Soil
Access real-time soil data via Ambee — monitor soil moisture, temperature, and properties globally for precision agriculture from any AI agent.

NOAA Space Weather — Solar & Geomagnetic Intelligence
Real-time space weather intelligence: planetary Kp geomagnetic index, 3-day Kp forecast, solar wind speed and magnetic field, aurora probability forecast (Ovation model), solar flux (F10.7), and Dst storm index from NOAA SWPC.

OpenAlex
Access 250M+ scholarly works with open bibliometric data — search papers, authors, institutions, and trending research topics. The open-source alternative to Scopus and Web of Science.
You might also like

ThirdWeb
Integrate Web3 capabilities into your AI agent — manage wallets, authenticate users, and interact with smart contracts across multiple blockchains.

Walmart Connect Ads
Manage Walmart Sponsored Search campaigns, budgets, keywords, and performance reports with AI. Exclusive for Walmart Connect Partner Network members.
Cometly
Enable your AI agent to track conversions, retrieve attribution data, and monitor campaigns via the Cometly API.