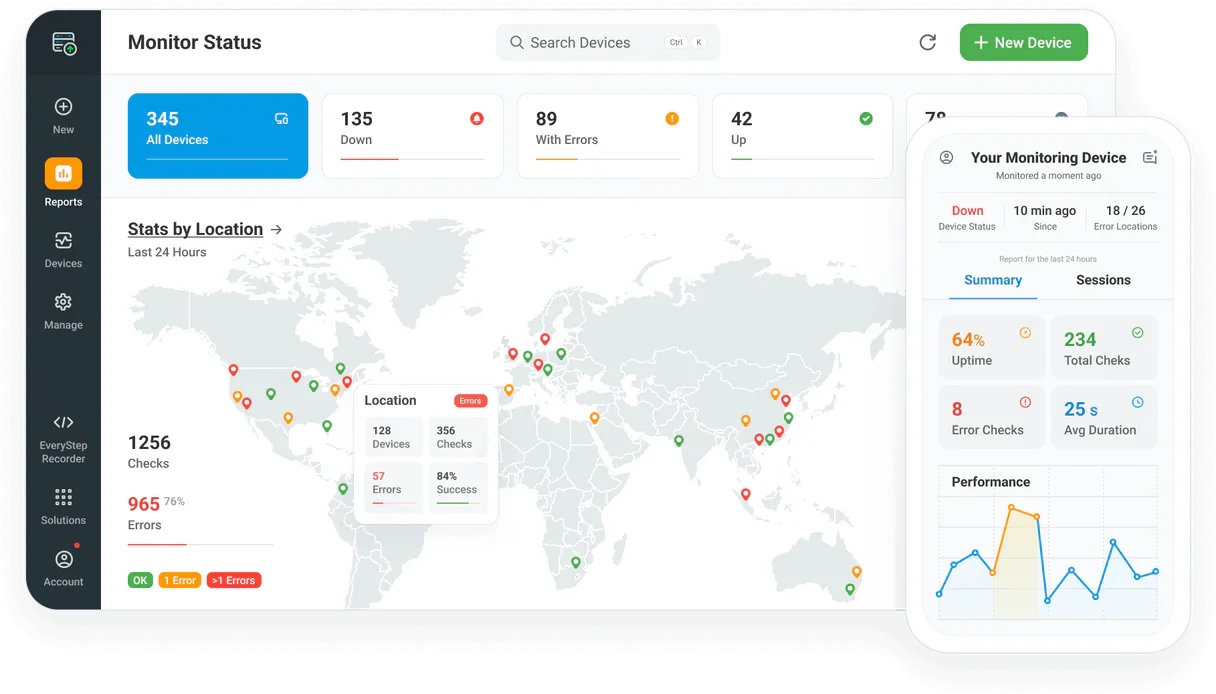
Dotcom-Monitor MCP Server with 6 Tools Ready for AI Agents
Monitor website uptime, page load speed, and server health from multiple global locations with instant alert notifications. Unlock 6 tools ready out of the box. Connect this App Connector to instantly empower AI agents like Claude Code, Cursor, or any MCP-compatible client with advanced capabilities.
Ask AI about this App Connector
Vinkius delivers Streamable HTTP and SSE to any MCP client
* Every MCP server runs on Vinkius-managed infrastructure inside AWS - a purpose-built runtime with per-request V8 isolates, Ed25519 signed audit chains, and sub-40ms cold starts optimized for native MCP execution. See our infrastructure
What is the Dotcom-Monitor MCP Server?
The Dotcom-Monitor MCP Server gives AI agents like Claude, ChatGPT, and Cursor direct access to Dotcom-Monitor via 6 tools. Monitor website uptime, page load speed, and server health from multiple global locations with instant alert notifications. Powered by the Vinkius - no API keys, no infrastructure, connect in under 2 minutes.
Built-in capabilities (6)
Tools for your AI Agents to operate Dotcom-Monitor
Ask your AI agent "List all active monitoring devices in my account." and get the answer without opening a single dashboard. With 6 tools connected to real Dotcom-Monitor data, your agents reason over live information, cross-reference it with other MCP servers, and deliver insights you would spend hours assembling manually.
Works with Claude, ChatGPT, Cursor, and any MCP-compatible client. Powered by the Vinkius - your credentials never touch the AI model, every request is auditable. Connect in under two minutes.
Why teams choose Vinkius
One subscription gives you access to thousands of MCP servers - and you can deploy your own to the Vinkius Edge. Your AI agents only access the data you authorize, with DLP that blocks sensitive information from ever reaching the model, kill switch for instant shutdown, and up to 60% token savings. Enterprise-grade infrastructure and security, zero maintenance.
Build your own MCP Server with our secure development framework →The Dotcom-Monitor App Connector works with every AI agent you already use
…and any MCP-compatible client
Use all 6 Dotcom-Monitor tools with your AI agents right now
Empower your AI agents to connect to Dotcom-Monitor and securely perform advanced actions on Vinkius infrastructure. Beyond a simple connection, you gain an advanced AI Gateway that provides complete visibility into agent activity, ensuring maximum governance and optimized token usage.
Get details for a specific device
Get historical status for a device
List configured alert groups
). List monitoring platforms
List monitoring devices
List geographic monitoring locations
What the Dotcom-Monitor MCP Server unlocks
Connect your Dotcom-Monitor monitoring account to any AI agent and simplify how you oversee your website uptime, server performance, and global monitoring locations through natural conversation.
What you can do
- Device Oversight — List all configured monitoring devices (uptime, speed, API) and retrieve detailed configuration metadata.
- Performance Tracking — Query historical status data and response times to identify latency trends via AI.
- Global Monitoring — List available geographic locations and verify where your checks are running from.
- Alert Management — Query configured alert groups and notification teams to ensure your incident response is ready.
- Platform Analysis — List available monitoring platforms (ServerView, UserView, WebAPI) to coordinate your checks.
- Operational Monitoring — Check real-time device health and verify system connectivity directly from the agent.
How it works
1. Subscribe to this server
2. Enter your Dotcom-Monitor API Key (found in your account settings)
3. Start monitoring your digital assets from Claude, Cursor, or any MCP client
Who is this for?
- DevOps & SREs — quickly retrieve historical performance logs and verify device statuses via simple AI commands.
- IT Managers — monitor global uptime and verify alert group configurations directly from the workspace.
- Web Developers — check response times and verify platform availability via the AI assistant.
Frequently asked questions about the Dotcom-Monitor MCP Server
Can I check the uptime status of a specific device via AI?
Yes! Use the get_device_details tool and provide the Device ID. Your agent will retrieve the current operational status and basic performance metrics.
How do I see the history of response times for a monitor?
Run the get_device_monitoring_history query with your Device ID. The agent will retrieve a historical log of success/failure states and latency data.
Is it possible to list all geographic monitoring locations via AI?
Absolutely. Use the list_monitoring_locations query. The agent will retrieve the complete list of worldwide regions where Dotcom-Monitor agents are available.
More in this category

DPD
10 toolsStreamline your logistics and shipping with DPD.

Tencent TMT / 腾讯机器翻译
10 toolsTencent's professional machine translation — translate text and detect languages with high precision via AI.

Postscript
12 toolsDrive Shopify revenue with SMS and MMS marketing that feels personal, converts browsers into buyers, and builds lasting loyalty.
You might also like
Volcengine RTC
10 toolsBring ByteDance's internal RTC Engine to your AI workflow. Administrate audio/video calls, manage servers, and start Mixes.

99Minutos Express
12 toolsCall physical couriers via AI using 99Minutos. Extract immediate Last-mile shipping quotes and trace vehicle checkpoints dynamically.
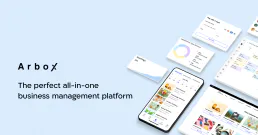
Arbox
14 toolsRun your fitness studio or gym with member management, class scheduling, and payment processing in one connected platform.