Dotcom-Monitor MCP Server for ClineGive Cline instant access to 6 tools to Get Device Details, Get Device Monitoring History, List Alert Groups, and more
Cline is an autonomous AI coding agent inside VS Code that plans, executes, and iterates on tasks. Wire Dotcom-Monitor through Vinkius and Cline gains direct access to every tool. from data retrieval to workflow automation. without leaving the terminal.
Ask AI about this App Connector for Cline
The Dotcom-Monitor app connector for Cline is a standout in the Industry Titans category — giving your AI agent 6 tools to work with, ready to go from day one.
Vinkius delivers Streamable HTTP and SSE to any MCP client
Vinkius Desktop App
The modern way to manage MCP Servers — no config files, no terminal commands. Install Dotcom-Monitor and 3,400+ MCP Servers from a single visual interface.


{
  "mcpServers": {
    "dotcom-monitor": {
      "url": "https://edge.vinkius.com/[YOUR_TOKEN_HERE]/mcp"
    }
  }
}
* Every MCP server runs on Vinkius-managed infrastructure inside AWS - a purpose-built runtime with per-request V8 isolates, Ed25519 signed audit chains, and sub-40ms cold starts optimized for native MCP execution. See our infrastructure
About Dotcom-Monitor MCP Server
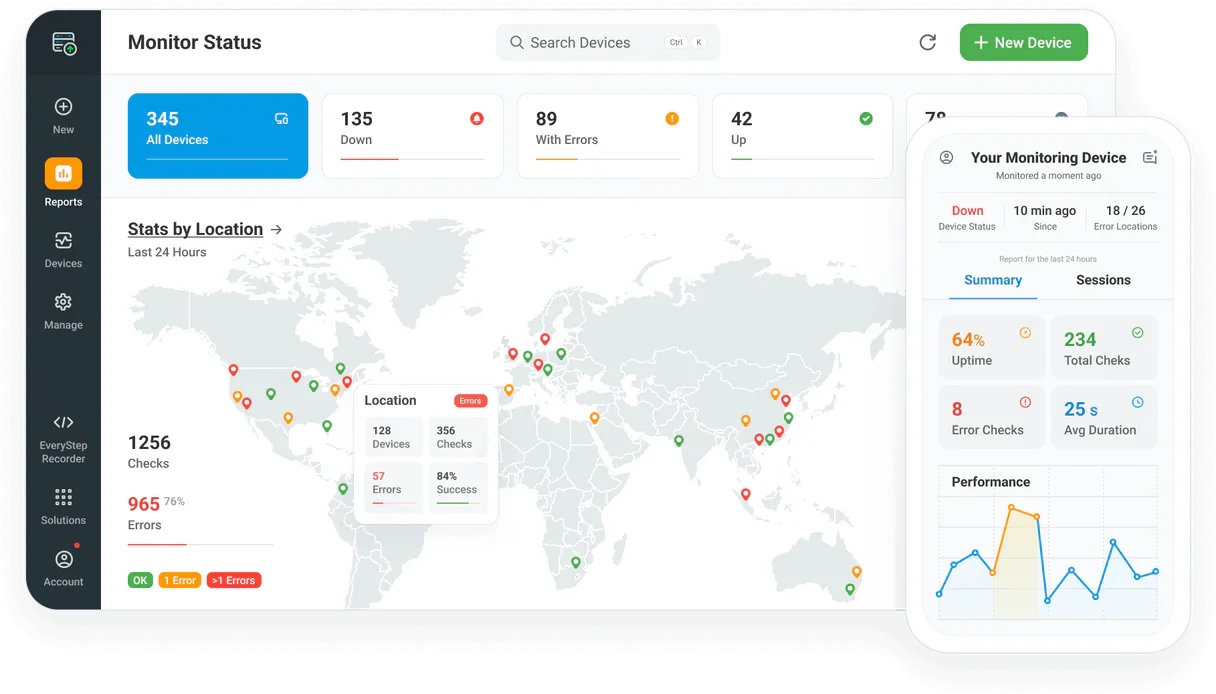
Connect your Dotcom-Monitor monitoring account to any AI agent and simplify how you oversee your website uptime, server performance, and global monitoring locations through natural conversation.
Cline operates autonomously inside VS Code. it reads your codebase, plans a strategy, and executes multi-step tasks including Dotcom-Monitor tool calls without waiting for prompts between steps. Connect 6 tools through Vinkius and Cline can fetch data, generate code, and commit changes in a single autonomous run.
What you can do
- Device Oversight — List all configured monitoring devices (uptime, speed, API) and retrieve detailed configuration metadata.
- Performance Tracking — Query historical status data and response times to identify latency trends via AI.
- Global Monitoring — List available geographic locations and verify where your checks are running from.
- Alert Management — Query configured alert groups and notification teams to ensure your incident response is ready.
- Platform Analysis — List available monitoring platforms (ServerView, UserView, WebAPI) to coordinate your checks.
- Operational Monitoring — Check real-time device health and verify system connectivity directly from the agent.
The Dotcom-Monitor MCP Server exposes 6 tools through the Vinkius. Connect it to Cline in under two minutes — no API keys to rotate, no infrastructure to provision, no vendor lock-in. Your configuration, your data, your control.
All 6 Dotcom-Monitor tools available for Cline
When Cline connects to Dotcom-Monitor through Vinkius, your AI agent gets direct access to every tool listed below — spanning uptime-monitoring, website-performance, server-health, and more. Every call is secured with network, filesystem, subprocess, and code evaluation entitlements inside a sandboxed runtime. Beyond a simple connection, you get a full AI Gateway with real-time visibility into agent activity, enterprise governance, and optimized token usage.
Get details for a specific device
Get historical status for a device
List configured alert groups
). List monitoring platforms
List monitoring devices
List geographic monitoring locations
Connect Dotcom-Monitor to Cline via MCP
Follow these steps to wire Dotcom-Monitor into Cline. The entire setup takes under two minutes — your credentials stay safe behind the Vinkius.
Open Cline MCP Settings
Add remote server
Enable the server
Start using Dotcom-Monitor
Why Use Cline with the Dotcom-Monitor MCP Server
Cline provides unique advantages when paired with Dotcom-Monitor through the Model Context Protocol.
Cline operates autonomously. it reads your codebase, plans a strategy, and executes multi-step tasks including MCP tool calls without step-by-step prompts
Runs inside VS Code, so you get MCP tool access alongside your existing extensions, terminal, and version control in a single window
Cline can create, edit, and delete files based on MCP tool responses, enabling end-to-end automation from data retrieval to code generation
Transparent execution: every tool call and file change is shown in Cline's activity log for full visibility and approval before committing
Dotcom-Monitor + Cline Use Cases
Practical scenarios where Cline combined with the Dotcom-Monitor MCP Server delivers measurable value.
Autonomous feature building: tell Cline to fetch data from Dotcom-Monitor and scaffold a complete module with types, handlers, and tests
Codebase refactoring: use Dotcom-Monitor tools to validate live data while Cline restructures your code to match updated schemas
Automated testing: Cline fetches real responses from Dotcom-Monitor and generates snapshot tests or mocks based on actual payloads
Incident response: query Dotcom-Monitor for real-time status and let Cline generate hotfix patches based on the findings
Example Prompts for Dotcom-Monitor in Cline
Ready-to-use prompts you can give your Cline agent to start working with Dotcom-Monitor immediately.
"List all active monitoring devices in my account."
"Show me the monitoring history for device 'dev_10293'."
"What are the available alert groups in my account?"
Troubleshooting Dotcom-Monitor MCP Server with Cline
Common issues when connecting Dotcom-Monitor to Cline through the Vinkius, and how to resolve them.
Server shows error in sidebar
Dotcom-Monitor + Cline FAQ
Common questions about integrating Dotcom-Monitor MCP Server with Cline.