Dotcom-Monitor MCP Server for Claude CodeGive Claude Code instant access to 6 tools to Get Device Details, Get Device Monitoring History, List Alert Groups, and more
Claude Code is Anthropic's agentic CLI for terminal-first development. Add Dotcom-Monitor as an MCP server in one command and Claude Code will discover every tool at runtime. ideal for automation pipelines, CI/CD integration, and headless workflows via Vinkius.
Ask AI about this App Connector for Claude Code
The Dotcom-Monitor app connector for Claude Code is a standout in the Industry Titans category — giving your AI agent 6 tools to work with, ready to go from day one.
Vinkius delivers Streamable HTTP and SSE to any MCP client
Vinkius Desktop App
The modern way to manage MCP Servers — no config files, no terminal commands. Install Dotcom-Monitor and 3,400+ MCP Servers from a single visual interface.


# Your Vinkius token. get it at cloud.vinkius.com
claude mcp add dotcom-monitor --transport http "https://edge.vinkius.com/[YOUR_TOKEN_HERE]/mcp"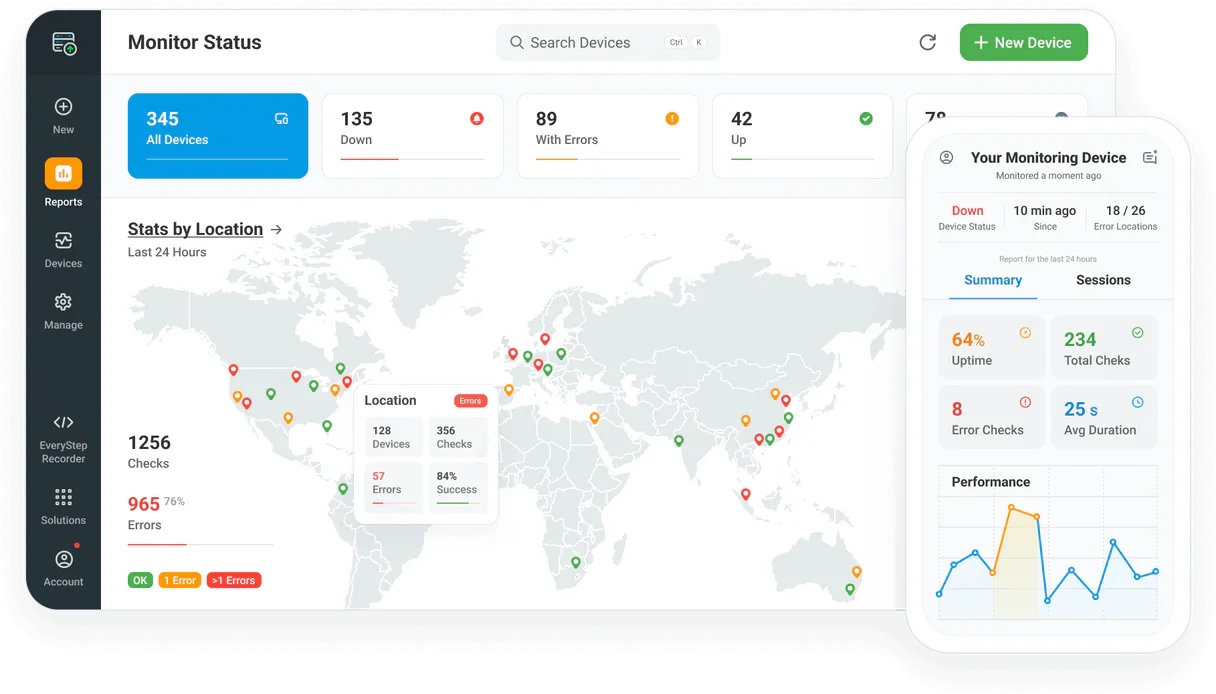
* Every MCP server runs on Vinkius-managed infrastructure inside AWS - a purpose-built runtime with per-request V8 isolates, Ed25519 signed audit chains, and sub-40ms cold starts optimized for native MCP execution. See our infrastructure
About Dotcom-Monitor MCP Server
Connect your Dotcom-Monitor monitoring account to any AI agent and simplify how you oversee your website uptime, server performance, and global monitoring locations through natural conversation.
Claude Code registers Dotcom-Monitor as an MCP server in a single terminal command. Once connected, Claude Code discovers all 6 tools at runtime and can call them headlessly. ideal for CI/CD pipelines, cron jobs, and automated workflows where Dotcom-Monitor data drives decisions without human intervention.
What you can do
- Device Oversight — List all configured monitoring devices (uptime, speed, API) and retrieve detailed configuration metadata.
- Performance Tracking — Query historical status data and response times to identify latency trends via AI.
- Global Monitoring — List available geographic locations and verify where your checks are running from.
- Alert Management — Query configured alert groups and notification teams to ensure your incident response is ready.
- Platform Analysis — List available monitoring platforms (ServerView, UserView, WebAPI) to coordinate your checks.
- Operational Monitoring — Check real-time device health and verify system connectivity directly from the agent.
The Dotcom-Monitor MCP Server exposes 6 tools through the Vinkius. Connect it to Claude Code in under two minutes — no API keys to rotate, no infrastructure to provision, no vendor lock-in. Your configuration, your data, your control.
All 6 Dotcom-Monitor tools available for Claude Code
When Claude Code connects to Dotcom-Monitor through Vinkius, your AI agent gets direct access to every tool listed below — spanning uptime-monitoring, website-performance, server-health, and more. Every call is secured with network, filesystem, subprocess, and code evaluation entitlements inside a sandboxed runtime. Beyond a simple connection, you get a full AI Gateway with real-time visibility into agent activity, enterprise governance, and optimized token usage.
Get details for a specific device
Get historical status for a device
List configured alert groups
). List monitoring platforms
List monitoring devices
List geographic monitoring locations
Connect Dotcom-Monitor to Claude Code via MCP
Follow these steps to wire Dotcom-Monitor into Claude Code. The entire setup takes under two minutes — your credentials stay safe behind the Vinkius.
Install Claude Code
npm install -g @anthropic-ai/claude-code if not already installedAdd the MCP Server
Verify the connection
claude mcp to list connected servers, or type /mcp inside a sessionStart using Dotcom-Monitor
Why Use Claude Code with the Dotcom-Monitor MCP Server
Claude Code provides unique advantages when paired with Dotcom-Monitor through the Model Context Protocol.
Single-command setup: `claude mcp add` registers the server instantly. no config files to edit or applications to restart
Terminal-native workflow means MCP tools integrate seamlessly into shell scripts, CI/CD pipelines, and automated DevOps tasks
Claude Code runs headlessly, enabling unattended batch processing using Dotcom-Monitor tools in cron jobs or deployment scripts
Built by the same team that created the MCP protocol, ensuring first-class compatibility and the fastest adoption of new protocol features
Dotcom-Monitor + Claude Code Use Cases
Practical scenarios where Claude Code combined with the Dotcom-Monitor MCP Server delivers measurable value.
CI/CD integration: embed Dotcom-Monitor tool calls in your deployment pipeline to validate configurations or fetch secrets before shipping
Headless batch processing: schedule Claude Code to query Dotcom-Monitor nightly and generate reports without human intervention
Shell scripting: pipe Dotcom-Monitor outputs into other CLI tools for data transformation, filtering, and aggregation
Infrastructure monitoring: run Claude Code in a cron job to query Dotcom-Monitor status endpoints and alert on anomalies
Example Prompts for Dotcom-Monitor in Claude Code
Ready-to-use prompts you can give your Claude Code agent to start working with Dotcom-Monitor immediately.
"List all active monitoring devices in my account."
"Show me the monitoring history for device 'dev_10293'."
"What are the available alert groups in my account?"
Troubleshooting Dotcom-Monitor MCP Server with Claude Code
Common issues when connecting Dotcom-Monitor to Claude Code through the Vinkius, and how to resolve them.
Command not found: claude
npm install -g @anthropic-ai/claude-codeConnection timeout
Dotcom-Monitor + Claude Code FAQ
Common questions about integrating Dotcom-Monitor MCP Server with Claude Code.
How do I add an MCP server to Claude Code?
claude mcp add --transport http "" in your terminal. Claude Code registers the server and discovers all tools immediately.Can Claude Code run MCP tools in headless mode?
How do I list all connected MCP servers?
claude mcp in your terminal to see all registered servers and their status, or type /mcp inside an active Claude Code session.