Helicone (LLM Observability) MCP. Audit every API call, track costs, and debug agent performance.
 Gemini
 Works with every AI agent you already use
…and any MCP-compatible client
Just plug in your AI agents and start using Vinkius.
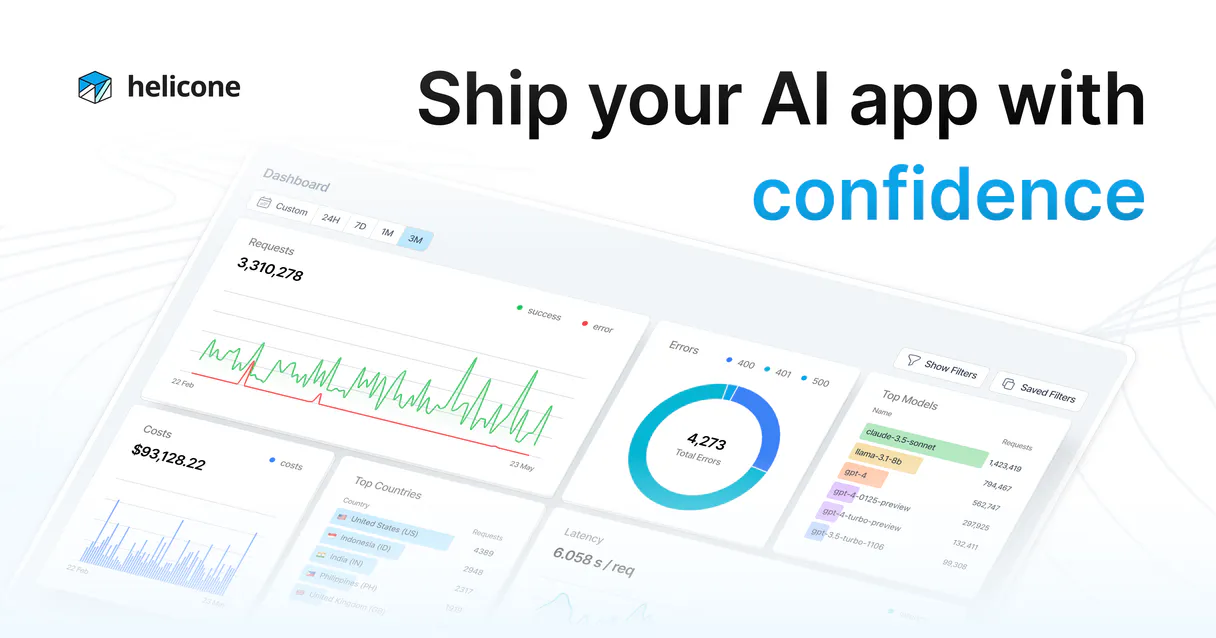
Helicone (LLM Observability) tracks your AI usage in real-time. Monitor requests, analyze costs per model or user, and measure latency across all LLM providers.
You can also track multi-turn session graphs, manage prompt versions, and log user feedback directly through your agent. It gives you full visibility into your AI spend and performance.
What your AI agents can do
Get prompt versions
Retrieves all managed versions of a specific prompt template.
List properties
Identifies active properties associated with the gateway authentication.
Log feedback
Records user feedback (Thumbs Up/Down) and offline critiques for model improvement.
Queries track spending by model, user, or custom metadata properties to monitor your AI burn rate in real-time.
Determines the Time To First Token (TTFT) and isolates performance issues linked to specific LLM providers.
Retrieves deep proxy logs, showing the exact prompts and outputs sent to LLM APIs by your agent.
Isolates and analyzes multi-turn graph traces connecting consecutive LLM calls to debug complex agentic workflows.
Accesses managed prompt versions and tracks changes in your AI instruction logic over time.
Tracks precise LLM interactions using Helicone tags to identify the most active human clients.
Ask AI about this MCP
Supported MCP Clients
Gemini Waiting for input…
Helicone (LLM Observability) MCP Server: 10 Tools
Use these tools to query costs, analyze performance, track user activity, and manage prompts across your entire LLM stack.
019d75afget prompt versions
Retrieves all managed versions of a specific prompt template.
019d75aflist properties
Identifies active properties associated with the gateway authentication.
019d75aflog feedback
Records user feedback (Thumbs Up/Down) and offline critiques for model improvement.
019d75afquery costs
Calculates spending based on various account and usage properties.
019d75afquery feedback
Inspects stored user feedback data and critiques.
019d75afquery latency
Generates performance data, including Time To First Token (TTFT) metrics.
019d75afquery prompts
Retrieves detailed cloud logging logs related to prompt usage and limits.
019d75afquery requests
Gets a list of all API requests made through the platform gateway.
019d75afquery sessions
Lists all structured rules and metrics from multi-turn agent sessions.
019d75afquery users
Dispatches a validation check and lists user history data.
Choose How to Get Started
Build a custom MCP for your own tools, or connect a ready-made integration from our catalog.
Build Your Own
Turn any API into an MCP. Import a spec, define Agent Skills, or deploy with MCPFusion.
- Import from OpenAPI, Swagger, or YAML specs
- Create Agent Skills with progressive disclosure
- Deploy to edge with MCPFusion framework
- Built in DLP, auth, and compliance on every call
- Real time usage dashboard and cost metering
- Publish to catalog or keep private
Make Your AI Do More
Start with Helicone (LLM Observability), then connect any of our 4,700+ other servers whenever your AI needs more. One click, no limits.
- Use this MCP plus 4,700+ others, all in one place
- Add new capabilities to your AI anytime you want
- Every connection is secured and compliant automatically
- Track usage and costs across all your servers
- Works with Claude, ChatGPT, Cursor, and more
- New servers added to the catalog every week
What you can do with this MCP connector
Helicone's observability server lets your agent keep a tight leash on your AI usage. You'll get full visibility into where you're spending money and why things feel sluggish. query_costs lets you calculate spending by model, user, or custom metadata, so you'll always know your AI burn rate. query_latency gives you performance data, including Time To First Token (TTFT) metrics, letting you pinpoint slowness tied to specific LLM providers. query_requests retrieves deep proxy logs, showing the exact prompts and outputs your agent sends to LLM APIs.
You can trace complex workflows with query_sessions, which lists structured rules and metrics from multi-turn agent sessions. To manage your prompts, get_prompt_versions retrieves every managed version of a specific prompt template. You can track user activity with query_users, which validates and lists user history data. You'll keep track of user sentiment and help fine-tune models by calling log_feedback, which records user feedback (Thumbs Up/Down) and offline critiques.
To see what users are telling you, query_feedback inspects all stored user feedback and critiques. query_prompts gets detailed cloud logging logs related to prompt usage and limits. You can also check what's running on the gateway using list_properties, which identifies active properties associated with the gateway authentication. Finally, query_skills lets you check all available tools for your agent.
How Helicone (LLM Observability) MCP Works
- 1 Subscribe to the Helicone server and enter your API key.
- 2 Connect your AI client (Claude, Cursor, or any MCP-compatible client).
- 3 Use your agent to query performance data. You get real-time insights into costs, latency, and usage patterns.
The bottom line is you get a single, natural chat interface to audit and optimize your entire LLM infrastructure.
Who Is Helicone (LLM Observability) MCP For?
This is for the LLM Engineer who needs to debug prompt performance and measure TTFT latency across multiple providers. It's for the Product Owner monitoring AI spending and calculating costs per user. Data Scientists use it to analyze user feedback and improve model response quality. DevOps/SREs rely on it to ensure the availability and reliability of the AI gateway.
Uses the server to debug prompt performance and measure TTFT latency across different upstream LLM providers.
Monitors AI spending and calculates costs per user, feature, or organization.
Analyzes user feedback and logs critiques to improve model response quality.
Ensures the availability and reliability of the AI gateway and proxy layers.
What Changes When You Connect
- See your AI burn rate in real-time. The
query_coststool lets you break down spending by model, user, or custom metadata, so you know exactly what you're paying for. - Pinpoint slow parts of your system. Use
query_latencyto measure Time To First Token (TTFT) and figure out which upstream LLM provider is causing the slowdown. - Track complex agent behaviors. The
query_sessionstool isolates multi-turn graph traces, letting you debug complex workflows step by step. - Manage your instructions.
get_prompt_versionstracks all changes to your core prompts, so you never lose track of which version was running when. - Understand user intent. The
query_userstool tracks precise interactions, helping you identify your most active or valuable human clients. - Improve model quality. Use
log_feedbackto log user critiques (thumbs up/down) directly, feeding data back into your model grounding process.
Real-World Use Cases
Billing Dispute: Need to know why the bill is too high.
A Product Owner notices the AI bill is spiking. They ask their agent: 'What did we spend on GPT-4o last week?' The agent runs query_costs and identifies that a specific 'Customer Support' feature tag drove the bulk of the cost, allowing the PO to limit that usage.
Debugging Slowness: The agent feels laggy.
An LLM Engineer reports that the agent is slow. They ask: 'Show me the 10 slowest requests from the last hour.' The agent runs query_latency and immediately identifies that the highest TTFT came from an 'anthropic.claude-3-opus' call, pointing the fix to the specific provider.
Auditing Logic: Why did the agent give the wrong answer last week?
A Data Scientist suspects the agent's instructions changed. They ask: 'List all versions for the customer service bot prompt.' The agent runs get_prompt_versions and shows that Version 3 was active for three months, but Version 5 was deployed two days ago with updated grounding rules, confirming the change point.
Fixing a Workflow: The multi-step agent keeps failing.
A DevOps engineer observes a complex agent flow failing intermittently. They ask the agent to 'Show me the full interaction graph for the last failure.' The agent runs query_sessions, isolating the exact sequence of LLM calls that led to the breakdown.
The Tradeoffs
Manual Dashboard Hunting
Logging into separate billing systems, then switching to a separate latency dashboard, and manually cross-referencing dates and IDs. This takes 30 minutes and requires exporting three different CSV files.
→
Use the agent to run query_costs and query_latency in one conversation. The agent combines the data, telling you, 'Spending was X, and the average TTFT was Y.' You get the full picture instantly.
Guessing Prompt Versions
Assuming the latest prompt version is the one causing the issue, and rolling it back without knowing the exact dates it was deployed or what rules were active.
→
Use get_prompt_versions to list all past versions. You can then pinpoint exactly when Version 4 was active and what its specific instruction text was.
Ignoring User Context
Tuning the model based on general metrics, without knowing if the poor performance was specific to a high-value user or a new feature rollout.
→
Use query_users to filter interactions by specific tags. This lets you see the LLM performance only for your most active client segment, making your improvements targeted.
When It Fits, When It Doesn't
Use this if you need to tie performance metrics (latency) directly to business outcomes (cost). You need to know not just that the model is slow, but who is slow, what prompt caused it, and how much it cost. This server is for optimization and auditing. Don't use it if you just need a simple counter (e.g., 'how many messages were sent'). For simple counting, a basic messaging logging tool works. If you only care about the prompt text and don't care about cost or latency, a basic logging service might suffice. But if you need to calculate cost by user and track latency by model, you need the detailed view this server provides.
Independent Platform Disclaimer: Vinkius is an independent platform and is not affiliated with, endorsed by, sponsored by, verified by, or otherwise authorized by Helicone. All third-party trademarks, logos, and brand names are the property of their respective owners. Their use on this website is strictly for informational purposes to identify service compatibility and interoperability.
VINKIUS INFRASTRUCTURE
Cloud Hosted
Managed infra
V8 Isolated
Sandboxed per request
Zero-Trust Proxy
No stored credentials
DLP Enforced
Policy on every call
GDPR Compliant
EU data residency
Token Compression
~60% cost reduction
Works with Claude, ChatGPT, Cursor, and more
The Model Context Protocol standardizes how applications expose capabilities to LLMs. Instead of operating in isolation, your AI gains direct access to external platforms, live data, and real-world actions through secure, standardized connections.
This server provides 10 capabilities that interface natively with Claude, ChatGPT, Cursor, and any MCP client. No middleware. No custom integration required.
Available Capabilities
Tracking AI Usage Used to Be a Spreadsheet Nightmare.
Before this server, you had to jump between a billing dashboard, a separate logging console, and a dedicated performance monitoring tool. You’d spend hours cross-referencing dates and trying to match a high cost spike to a specific slow request. You’d end up with three different, unlinked sources of truth.
Now, you tell your agent, 'Show me the cost of the last 10 slow requests.' The agent runs `query_costs` and `query_latency` and presents you with one clean, actionable list. It connects the money spent to the performance problem, instantly.
Helicone (LLM Observability) MCP Server: Understand the Full Lifecycle.
Manually checking prompt versions means logging into the prompt management UI, finding the specific prompt, and trying to remember which version was live on a given date. It’s prone to human error and misses context.
With this server, you simply ask: 'What were the grounding rules for the customer service bot on June 1st?' The agent runs `get_prompt_versions` and gives you the exact instruction text, closing the knowledge gap.
Common Questions About Helicone (LLM Observability) MCP
How do I use the `query_costs` tool in Helicone (LLM Observability)? +
You ask the agent directly. It runs query_costs and lets you break down spending by model, user, or custom tag. This is the best way to manage your AI budget.
What is TTFT latency using `query_latency`? +
TTFT stands for Time To First Token. Using query_latency, you measure how fast the model starts sending words. A high TTFT means the model is slow to respond, even if the average speed is okay.
Can I find out which users are using the AI most often with `query_users`? +
Yes. The agent runs query_users and provides a list of user history data. This helps you identify your most active or most valuable human clients.
How does `query_sessions` help debug complex agent workflows? +
The query_sessions tool enumerates structured rules for multi-turn graph traces. This lets you see the entire conversation path and pinpoint where the agent deviated from the expected flow.
What is the difference between `query_requests` and `query_sessions`? +
query_requests lists every single API call (the raw action). query_sessions groups those calls into structured, multi-turn conversations, showing the flow between them.
How do I use the `get_prompt_versions` tool to track changes in my instructions? +
It shows a history of every prompt version. You can see when a version was deployed and by whom, which is critical for tracking changes to your AI instructions.
What can I check using the `query_feedback` tool? +
You inspect logged user critiques. This lets you see thumbs up/down signals and offline Human-in-the-Loop verdicts to directly improve your model's performance.
How does `query_prompts` help me debug API calls? +
This tool retrieves explicit cloud logging. It shows the exact prompts and outputs sent to the LLM APIs, allowing you to trace and debug specific vault limits.
Can I see the exact prompt that caused a specific error? +
Yes. Use the query_requests tool to fetch direct prompts and outputs from the proxy logs. You can filter by status or custom tags to find the exact interaction that needs debugging.
How do I track costs for a specific customer ID? +
Ask your agent to query_costs and include your customer identity in the filter. Helicone maps costs per model and user, allowing you to see exactly how much each client is burning in LLM tokens.
Can my agent log human feedback into Helicone? +
Absolutely. Use the log_feedback tool to inject offline Human-in-the-Loop verdicts or text critiques directly into Helicone's database, helping you refine your model's grounding over time.
Multi-server workflows that include Helicone (LLM Observability) MCP
Cut AI Model Costs Without Losing Quality via MCP
Your GPT-4o bill is $4,200/month and 60% of those calls could run on Groq for $0.003 , your agent finds the waste
Monitor AI Agent Performance Using MCP Servers
Your agents run in production but you cannot explain why one failed at 3am , fix that
Track LLM Cost vs Quality Using MCP Servers
Your OpenAI bill grew from $200 to $2,400 in 2 months and you have no idea which feature caused it , because you track API spend at the account level, not at the prompt level
Use it with your favorite AI tools
Connect this server to Cursor, Claude, VS Code, and more.
More in this category
Zilliz Cloud
Manage vector collections and perform similarity searches via Zilliz Cloud.

Mistral AI (Frontier LLMs & Embeddings)
Manage AI inference via Mistral — execute chat completions, generate RAG embeddings, and audit frontier models.

Synthesia
Connect your AI to Synthesia. Generate corporate AI avatar videos from text prompt, explore templates, and automatically dub existing media directly from the terminal.
You might also like

Follow Up Boss
Manage real estate leads, track deals, and oversee follow-up tasks via AI agents with Follow Up Boss.

SeatGeek
Search and list SeatGeek events, performers, and venues directly from your AI agent.

Drone CI
Automate your CI/CD workflows with Drone CI—manage repositories, monitor builds, and handle secrets directly from your AI agent.