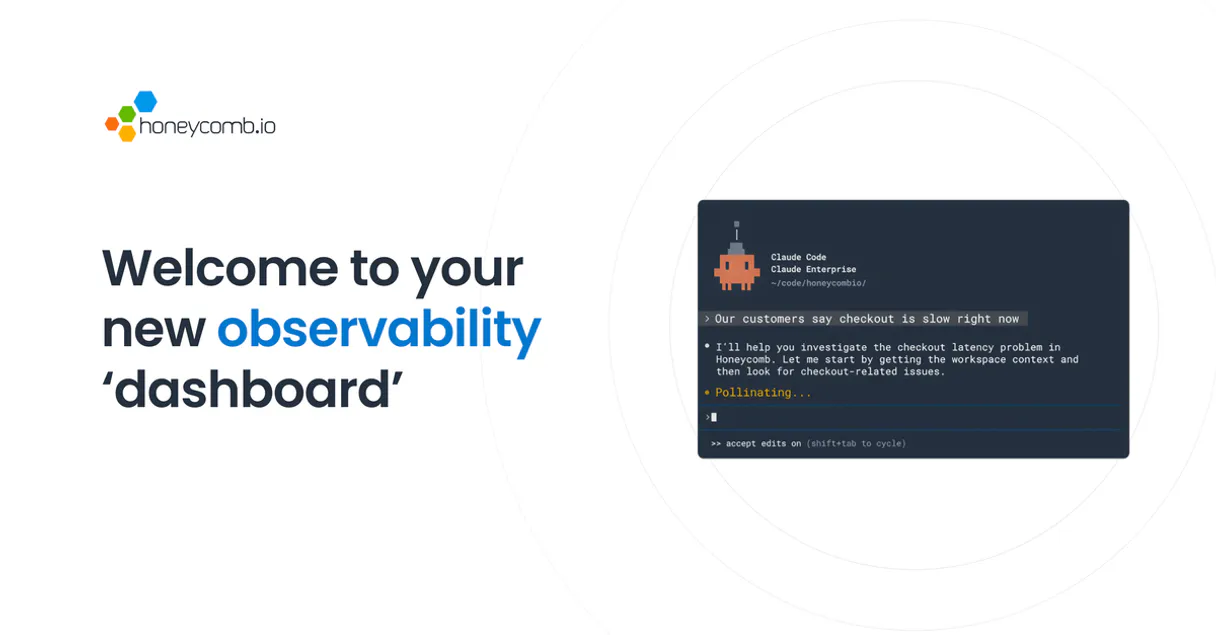
Honeycomb MCP. Query, track, and manage telemetry data with conversation.
 Gemini
 Works with every AI agent you already use
…and any MCP-compatible client
Just plug in your AI agents and start using Vinkius.
Honeycomb MCP Server connects your observability platform to your AI agent. You can manage datasets, run complex queries, and annotate data timelines using natural conversation.
Instead of building complicated query languages, you just tell your agent what you need to know about performance, deployments, or outages.
What your AI agents can do
Create marker
Adds a new annotation (like a deployment or maintenance window) to a dataset's timeline.
Create query specification
Builds a formal query plan for a specific dataset, returning a unique ID for later execution.
Get dataset details
Retrieves the basic metadata and configuration details for a specific dataset.
List datasets, check metadata, and view column schemas for any event source.
Create new query specifications and execute them to retrieve specific performance results.
Add permanent markers (e.g., 'v2.4.0 deployment') to a dataset's timeline to track major events.
List shared boards, check team configuration, and view available triggers and alerts.
Retrieve results from executed queries for deep troubleshooting and analysis.
Ask AI about this MCP
Supported MCP Clients
Gemini Waiting for input…
Honeycomb MCP Server: 12 Tools for Observability
Use these 12 tools to manage your telemetry data, from listing datasets to running complex, resource-intensive queries.
019d75b2create marker
Adds a new annotation (like a deployment or maintenance window) to a dataset's timeline.
019d75b2create query specification
Builds a formal query plan for a specific dataset, returning a unique ID for later execution.
019d75b2get dataset details
Retrieves the basic metadata and configuration details for a specific dataset.
019d75b2get query result
Fetches the final data output after a query has been executed.
019d75b2get team details
Gets information about the Honeycomb team configuration and settings.
019d75b2list dataset columns
Lists every column (field) defined within a specific dataset's schema.
019d75b2list datasets
Provides a list of all available datasets in your Honeycomb team for discovery.
019d75b2list honeycomb boards
Lists all existing dashboards (boards) shared within your Honeycomb team.
019d75b2list markers
Shows all existing timeline annotations for a given dataset.
019d75b2list queries
Lists the query specifications that have been saved for a specific dataset.
019d75b2list triggers
Lists all defined alerts or triggers for a specific dataset.
019d75b2run query
Executes a defined query specification and returns a job ID needed to retrieve the final data.
Choose How to Get Started
Build a custom MCP for your own tools, or connect a ready-made integration from our catalog.
Build Your Own
Turn any API into an MCP. Import a spec, define Agent Skills, or deploy with MCPFusion.
- Import from OpenAPI, Swagger, or YAML specs
- Create Agent Skills with progressive disclosure
- Deploy to edge with MCPFusion framework
- Built in DLP, auth, and compliance on every call
- Real time usage dashboard and cost metering
- Publish to catalog or keep private
Make Your AI Do More
Start with Honeycomb, then connect any of our 4,700+ other servers whenever your AI needs more. One click, no limits.
- Use this MCP plus 4,700+ others, all in one place
- Add new capabilities to your AI anytime you want
- Every connection is secured and compliant automatically
- Track usage and costs across all your servers
- Works with Claude, ChatGPT, Cursor, and more
- New servers added to the catalog every week
What you can do with this MCP connector
Honeycomb MCP Server hooks up your observability platform to your AI agent. Your agent can manage datasets, run complex queries, and put markers on data timelines using plain talk. You don't have to write complicated query languages; you just tell your agent what you need to know about performance, deployments, or outages.
Inspect Data Structure: Your agent can list all datasets available in your Honeycomb team, and it'll give you the basic metadata and configuration details for any specific dataset. You can also check what columns (fields) are defined in a dataset's schema, and it'll list them all out.
Define and Run Queries: Your agent builds a formal query plan for a dataset using create_query_specification, which returns a unique ID. You then execute that plan with run_query, which returns a job ID you need to use later. Once the job is done, you fetch the final output data with get_query_result.
Annotate Timelines: You can use create_marker to add a new annotation—say, a deployment or maintenance window—to a dataset's timeline. You can also view all existing timeline annotations for a given dataset by calling list_markers.
Manage Team Assets: Your agent can list all dashboards (boards) shared within your team using list_honeycomb_boards. You can check the team configuration details with get_team_details, and it'll list all defined alerts or triggers for a specific dataset using list_triggers. You can also view all saved query specifications for a dataset using list_queries.
Analyze Historical Data: To find out what's going on, your agent can list all datasets available with list_datasets. You can get the initial data structure overview with get_dataset_details, and you can see all the fields defined in a dataset with list_dataset_columns.
How Honeycomb MCP Works
- 1 Subscribe to the server and provide your Honeycomb API Key and region.
- 2 Tell your AI client to run a query or list datasets using natural language.
- 3 The agent calls the necessary tool (e.g.,
create_query_specification,run_query) and returns the actionable result.
The bottom line is, your AI client runs complex data operations against Honeycomb, returning structured results that fit right into your workflow.
Who Is Honeycomb MCP For?
This is for the SRE, the DevOps Engineer, and the Platform Lead who gets paid to find out why something broke at 2 a.m. You're tired of manually clicking through dashboards, running console queries, and cross-referencing metadata just to find a single metric. You need instant, conversational access to your core telemetry data.
Uses the agent to run complex queries during an incident, retrieve results, and automatically create markers for the outage period.
Inspects dataset schemas and runs queries to monitor the performance trends of new deployments or services.
Checks shared boards and monitors dataset usage across the organization to maintain a real-time overview of data assets.
What Changes When You Connect
- Instant RCA: Run complex queries and get results immediately. Instead of building a query DSL, you just ask the agent to 'Show me the latency spike on the payment gateway.'
- Contextual Markers: Automatically add markers using
create_marker. When an outage happens, the agent annotates the timeline, so you instantly see the full scope of the incident. - Schema Deep Dive: Use
list_dataset_columnsto inspect a dataset's schema. You don't need to jump to the data dictionary; the agent tells you what fields are available right when you need them. - Discovery Workflow: Start with
list_datasetsto see every event source. Then, checklist_honeycomb_boardsto see which dashboards are already built for that data. - Audit Trail: Manage your data flow by listing saved queries (
list_queries) and checking triggers (list_triggers). You maintain a clear record of what data is being monitored and why.
Real-World Use Cases
Investigating a Production Latency Spike
A user notices the API latency jumped last night. They ask their agent: 'What was the data health around 2 AM?' The agent runs list_datasets to confirm the correct source, uses create_query_specification to define the latency query, and finally executes run_query. The agent polls for results using get_query_result, delivering a graph of the performance dip in minutes.
Onboarding a New Service
A new service, 'Payment Gateway v3', goes live. The engineer needs to track its performance. They ask the agent to list datasets and find the right source. Then, they use create_marker to place a 'V3 Deployment' marker, and immediately set up a query to monitor its key metrics.
Auditing Data Changes
A Platform Lead needs to know if the 'user_activity' dataset structure changed. They use list_dataset_columns to check the current schema against expected fields. If they find discrepancies, they can list the available boards (list_honeycomb_boards) to see who else is impacted.
Pre-Mortem Analysis
Before a major release, the team wants to simulate failure points. They ask the agent to check the team configuration (get_team_details) and run specific queries across multiple datasets. This allows them to model failure and predict the impact before any code is merged.
The Tradeoffs
Manual Query Chaining
Manually logging into the Honeycomb UI, navigating to the dataset, writing the query in the DSL, hitting 'Run,' copying the result, and then manually creating a timeline marker in a separate view.
→
Use your agent to handle the sequence. First, call create_query_specification to define the query. Then, use run_query and get_query_result to get the data. Finally, use create_marker to annotate the timeline—all in one conversation.
Schema Guesswork
Assuming a column exists (e.g., 'error_code') and writing a query that fails because the actual field name is 'error_code_v2'.
→
Always run list_dataset_columns first. Use the list of actual fields returned by that tool to build your query specification, guaranteeing you're querying the correct data.
Running Queries in Isolation
Running a query for performance but forgetting to record the exact time of the run. Later, nobody knows if the data relates to a specific deployment or incident.
→
After running the query, immediately call create_marker to timestamp the analysis. This links the resulting data query to a specific event on the timeline.
When It Fits, When It Doesn't
Use this server if your core job is observing high-cardinality, time-series data, and you need to manage the data lifecycle (schema, queries, markers) through conversation. It's perfect for SREs and DevOps teams. Don't use it if you only need to view a simple, pre-built dashboard; just use the standard Honeycomb UI. If your goal is to ingest data from external sources, you need a different data pipeline tool, not an observability tool. This server is for deep analysis, not simple monitoring.
Independent Platform Disclaimer: Vinkius is an independent platform and is not affiliated with, endorsed by, sponsored by, verified by, or otherwise authorized by Honeycomb. All third-party trademarks, logos, and brand names are the property of their respective owners. Their use on this website is strictly for informational purposes to identify service compatibility and interoperability.
VINKIUS INFRASTRUCTURE
Cloud Hosted
Managed infra
V8 Isolated
Sandboxed per request
Zero-Trust Proxy
No stored credentials
DLP Enforced
Policy on every call
GDPR Compliant
EU data residency
Token Compression
~60% cost reduction
Works with Claude, ChatGPT, Cursor, and more
The Model Context Protocol standardizes how applications expose capabilities to LLMs. Instead of operating in isolation, your AI gains direct access to external platforms, live data, and real-world actions through secure, standardized connections.
This server provides 12 capabilities that interface natively with Claude, ChatGPT, Cursor, and any MCP client. No middleware. No custom integration required.
Available Capabilities
Debugging production performance shouldn't require remembering 12 different API endpoints.
Today, tracking down a performance issue means jumping between the query builder, the schema explorer, and the timeline view. You copy the dataset slug here, paste the column name there, write the query in the DSL, run it, and then manually create a marker for the time period. It's a frustrating sequence of copy/paste and context switching.
With this MCP server, you just talk to your agent. You tell it: 'Show me the latency spike for the payment API last Tuesday.' The agent handles listing the correct dataset, generating the query specification, executing it, and presenting the results—all without you leaving the chat window. It's pure conversational data access.
Honeycomb MCP Server: Get Data Insights with `get_query_result`
Before, getting results meant running the query and then waiting for a long-running job to finish in the UI. If you needed to share the data, you had to export a CSV or screenshot. It was slow, and the data wasn't always easily digestible.
Now, you trigger the query using `run_query`, and your agent manages the wait. It uses `get_query_result` to poll for the data and delivers the final, structured results directly to your agent output. You get the data, not just a link to where the data lives.
Common Questions About Honeycomb MCP
How do I use `list_datasets` with the Honeycomb MCP Server? +
You simply ask your agent to 'List all datasets.' The agent calls list_datasets and returns a list of available event sources and their slugs, which you need for every other tool.
What is the difference between `create_query_specification` and `run_query`? +
create_query_specification builds the query plan and returns a spec ID. run_query takes that spec ID and executes the query, giving you a result ID you must track to get the final data.
Can I use `create_marker` to mark an outage? +
Yes. You instruct your agent to 'Create a marker for the database outage.' The agent calls create_marker, annotating the dataset timeline for clear historical context.
Do I need to use `list_dataset_columns` before querying? +
While the agent can often infer column names, calling list_dataset_columns first lets you verify the exact schema. This prevents errors when writing complex queries.
How does `get_query_result` work after running a query? +
After run_query returns a result ID, you tell your agent to use get_query_result with that ID. The agent checks the status and retrieves the final, processed data.
How do I use `list_dataset_columns` to understand data structure? +
It lists all fields (columns) in a specific dataset. Use this tool before writing complex queries to confirm column names and data types, which prevents schema errors.
What is the purpose of `list_honeycomb_boards` and `list_markers` together? +
You first use list_honeycomb_boards to see shared team dashboards. Then, list_markers lets you check if any manual annotations already exist on the related datasets for context.
If my query fails, how can I use `get_dataset_details` to troubleshoot? +
It provides the core metadata for a dataset. Checking this helps you confirm the dataset's current status, last access time, and owner, which is key for diagnosing query failures.
How do I find my Honeycomb API Key? +
Log in to Honeycomb, go to Team Settings, and navigate to the API Keys section. You will be able to generate and copy your Team API Key from there. Ensure you also note your account's region.
Which region should I select? +
If your browser URL starts with ui.eu1.honeycomb.io, select EU. Otherwise, select US. Using the correct region is required for the integration to connect to the right API cluster.
Can I run a query and get the data back? +
Yes! Use the run_query tool with a valid query ID. It will return a result ID, which you can then pass to the get_query_result tool once the analysis is complete.
Is the integration secure for telemetry data? +
Absolutely. The integration uses official Honeycomb Team API keys over HTTPS. Your credentials and queried data are encrypted and stored securely within the Vinkius Cloud infrastructure.
Use it with your favorite AI tools
Connect this server to Cursor, Claude, VS Code, and more.
More in this category
SEC EDGAR Full — The Ultimate Free Bloomberg Alternative for AI Agents
The definitive SEC EDGAR Mega-Server: 13 tools spanning company lookup (8,000+ tickers), all filing types (10-K, 10-Q, 8-K), insider trading (Form 4), XBRL financial data extraction (revenue, income, assets, EPS), industry-wide comparison frames, and full-text search across every document ...

Confluent
Enable your AI agent to manage Kafka clusters, topics, and environments via the Confluent Cloud API.

Bureau of Labor Statistics Full — The Mega Server
The ultimate BLS Mega-Server: Access all 6 major datasets including CPI (Inflation), CES (Jobs), CPS (Unemployment), JOLTS (Turnover), LAUS (Local metrics), and OEWS (Wages by Profession).
You might also like

Moloco
Manage machine learning-powered advertising via Moloco — track campaigns and get analytics directly from your AI agent.

MeaningCloud
Advanced text analytics for sentiment analysis, topic extraction, language detection, and automatic summarization.
Upstash
Manage serverless Redis via Upstash REST API — execute commands, manage data structures and monitor your database from any AI agent.