Honeybadger MCP. Diagnose errors and track deployments from your chat.
 Gemini
 Works with every AI agent you already use
…and any MCP-compatible client
Just plug in your AI agents and start using Vinkius.
Honeybadger (Error Tracking) MCP Server monitors your application's health and exceptions. You can list all monitored projects, check uptime status across sites, and query fault groups to diagnose issues.
It lets you deep-dive into individual errors (notices) or mark faults as resolved, all through natural conversation.
What your AI agents can do
Get fault
Retrieves the complete details for a specific error group (fault) within Honeybadger.
Get notice
Retrieves the complete details for a single, specific error occurrence (notice).
Get project
Gets all the details for a single monitored Honeybadger project.
List all projects and get details on their API keys, languages, and current fault/notice counts.
List fault groups to understand common error patterns, including class names and environment distributions.
Get full details for a single error occurrence (notice), including its backtrace and request data.
List recent deployments to see which code revisions were pushed and when.
Mark a fault group as resolved or get all details on a specific fault.
List and check the uptime monitoring status for all configured sites.
Ask AI about this MCP
Supported MCP Clients
Gemini Waiting for input…
Honeybadger (Error Tracking) MCP Server: 10 Tools for Reliability
Use these tools to query project details, list faults, track deployments, and get deep error reports for any application stack.
019d75b2get fault
Retrieves the complete details for a specific error group (fault) within Honeybadger.
019d75b2get notice
Retrieves the complete details for a single, specific error occurrence (notice).
019d75b2get project
Gets all the details for a single monitored Honeybadger project.
019d75b2list deployments
Retrieves a list of recent code deployments registered for a project.
019d75b2list faults
Lists all error groups, providing class names, messages, and how many times they occurred.
019d75b2list members
Lists all team members and their roles assigned to a Honeybadger project.
019d75b2list notices
Lists individual error occurrences (notices) associated with a specific fault.
019d75b2list projects
Returns a list of all projects monitored by Honeybadger, including their status and fault counts.
019d75b2list sites
Lists all configured uptime monitoring sites for a given project.
019d75b2resolve fault
Changes the status of an error group (fault) to resolved, marking it as fixed.
Choose How to Get Started
Build a custom MCP for your own tools, or connect a ready-made integration from our catalog.
Build Your Own
Turn any API into an MCP. Import a spec, define Agent Skills, or deploy with MCPFusion.
- Import from OpenAPI, Swagger, or YAML specs
- Create Agent Skills with progressive disclosure
- Deploy to edge with MCPFusion framework
- Built in DLP, auth, and compliance on every call
- Real time usage dashboard and cost metering
- Publish to catalog or keep private
Make Your AI Do More
Start with Honeybadger (Error Tracking), then connect any of our 4,700+ other servers whenever your AI needs more. One click, no limits.
- Use this MCP plus 4,700+ others, all in one place
- Add new capabilities to your AI anytime you want
- Every connection is secured and compliant automatically
- Track usage and costs across all your servers
- Works with Claude, ChatGPT, Cursor, and more
- New servers added to the catalog every week
What you can do with this MCP connector
You connect your AI client to Honeybadger and manage your app's health right from your chat window. Stop switching between your IDE, the dashboard, and your chat. You can manage exceptions, track deployments, and check project status using only natural language.
Scope Projects
list_projects gives you a list of every project Honeybadger monitors, showing their status and how many faults they've racked up. You can use get_project to grab all the details on a single project, including its API keys, languages, and current fault and notice counts. You can also run list_members to see who's on the team and what their roles are for that project.
Find Error Groups
list_faults shows you all error groups, giving you the class names, messages, and how many times each error popped up. You can use get_fault to pull the complete details for a specific error group. If the issue is fixed, you can run resolve_fault to change the status of that fault group to resolved.
Inspect Specific Errors
list_notices lists individual error occurrences (notices) tied to a specific fault. You can then use get_notice to retrieve the full details for a single notice, including its backtrace and all the request data. This lets you deep-dive into exactly what went wrong with a specific error.
Check Site Status and Deployments
list_sites shows you all the configured uptime monitoring sites for a project. You can check the status of every site. list_deployments pulls a list of recent code deployments for a project, so you can see what code revisions got pushed and when. This helps you figure out if a specific change caused a regression.
- Developers: You debug exceptions and inspect backtraces right in your IDE, keeping your workflow totally uninterrupted. You can get the full details on a specific fault or notice ID to trace down the bug.
- SREs & DevOps: You monitor global site uptime and track deployment history to keep the infrastructure stable. You can check every configured site's status and see which code changes were rolled out.
- Leads: You audit unresolved fault counts and team assignments to manage incident response and improve bug-fixing workflows. You can check the status of every monitored project and see who's on the team.
How Honeybadger MCP Works
- 1 Subscribe to the server and provide your Honeybadger Personal Auth Token.
- 2 Your AI client uses the token to authenticate and connect to the Honeybadger API.
- 3 You ask your agent a question (e.g., 'What are the unresolved faults in Project X?'). The agent calls the necessary tools and formats the results into a conversational answer.
The bottom line is you get full application health monitoring and error management without opening a web browser.
Who Is Honeybadger MCP For?
The ops engineer who's tired of clicking through dashboards at 2 am. This is for developers, SREs, and engineering leads who need to diagnose complex, multi-faceted service degradation incidents fast. You need to see what's broken, where it broke, and who's responsible for fixing it—all from your terminal or IDE.
Inspect backtraces and get details on specific notices or faults without leaving the IDE. Use tools like get_notice or get_fault.
Monitor global uptime sites and track deployment histories (list_sites, list_deployments) to confirm if a recent code push caused the current incident.
Audit unresolved fault counts (list_faults) and check team assignments (list_members) to optimize incident response and triage.
What Changes When You Connect
- See the full scope of your application's issues. Use
list_projectsto see all monitored projects and check their overall fault and notice counts immediately. - Drill into the actual cause of failure. Instead of vague error messages,
get_noticeprovides the full backtrace and request context for a single error instance. - Pinpoint the bad code change. Use
list_deploymentsto see the revision history, confirming if a specific push triggered the current set of errors. - Know who to call. Run
list_membersto list team roles and owners for a project, helping you quickly assign ownership during an incident. - Manage the workflow. If a team fixes a bug, use
resolve_faultto mark the error group as resolved. This keeps your dashboard clean and focuses the team on real problems. - Monitor uptime proactively. Use
list_sitesto list all monitored sites and check their real-time availability status.
Real-World Use Cases
Pinpointing the Regression
A service is suddenly failing. Instead of guessing, the agent runs list_deployments for the affected project. The output shows that Revision 'a1b2c3d' was deployed two hours ago. The engineer then runs list_faults and finds a spike in a specific error group, correlating the two pieces of data to the bad push.
Auditing Team Ownership
The team is overwhelmed by unresolved faults. An engineer asks the agent to run list_members on the project. This immediately lists all team roles and owners, clarifying who needs to be contacted to start the fix.
Deep Dive Debugging
A developer sees an error ID but needs more context. They ask the agent to run get_notice using the ID. The agent pulls the full backtrace, the session context, and the request headers, allowing the developer to debug without leaving their coding environment.
Cleaning Up the Dashboard
The team has fixed a critical bug. Instead of manually clearing the error, the engineer asks the agent to resolve_fault for the specific error group. This updates the status in Honeybadger, keeping the dashboard accurate.
The Tradeoffs
Treating it like a dashboard
Manually checking the Honeybadger web dashboard for every error. You have to click into the project, then click into the fault group, then scroll to see the backtrace. It's a multi-tab, click-heavy process that takes minutes.
→
Let your agent run list_faults for an overview. If you need details, ask the agent to run get_fault or get_notice directly. You get the full data dump in a single conversation turn.
Assuming one tool is enough
Seeing a high fault count and just running list_faults gives you the message, but you don't know why it started happening or who should fix it. You're missing context.
→
First, use list_faults to find the error group. Then, ask the agent to run get_fault for details, and follow up by running list_members to see who owns the fix.
Forgetting to scope the search
Running a general search for 'database connection' errors without specifying the project or site. You get a massive, irrelevant list of potential issues.
→
Always start by using list_projects to confirm the correct project ID. Then, use list_sites to narrow the search to the specific environment or site that is reporting the issue.
When It Fits, When It Doesn't
Use this if you need to triage, scope, or debug a known failure. You need to move from 'what is wrong?' to 'what caused it and who fixes it?'.
Don't use this if you just need to know which API keys exist—use the project details view. Don't use it if you are trying to write documentation—use a dedicated documentation tool. This is for active incident response and debugging.
When diagnosing, start broad: list_projects → list_faults → list_sites to scope the area. Then, drill down: get_fault or get_notice. If it's fixed, use resolve_fault to close the loop.
Independent Platform Disclaimer: Vinkius is an independent platform and is not affiliated with, endorsed by, sponsored by, verified by, or otherwise authorized by Honeybadger. All third-party trademarks, logos, and brand names are the property of their respective owners. Their use on this website is strictly for informational purposes to identify service compatibility and interoperability.
VINKIUS INFRASTRUCTURE
Cloud Hosted
Managed infra
V8 Isolated
Sandboxed per request
Zero-Trust Proxy
No stored credentials
DLP Enforced
Policy on every call
GDPR Compliant
EU data residency
Token Compression
~60% cost reduction
Works with Claude, ChatGPT, Cursor, and more
The Model Context Protocol standardizes how applications expose capabilities to LLMs. Instead of operating in isolation, your AI gains direct access to external platforms, live data, and real-world actions through secure, standardized connections.
This server provides 10 capabilities that interface natively with Claude, ChatGPT, Cursor, and any MCP client. No middleware. No custom integration required.
Available Capabilities
Debugging shouldn't require a dozen browser tabs.
Today, finding an error means opening the monitoring dashboard. You click the project name, then find the fault group. You click that group, then you scroll down the page to find the backtrace. If you need to check related projects, you copy the project ID and paste it into a new tab.
With this MCP server, you just tell your agent what you need. "Show me the backtrace for the latest authentication error in production." The agent runs `get_notice` and spits out the full, formatted data right where you are working.
Honeybadger (Error Tracking) MCP Server
You stop bouncing between the monitoring dashboard, the project settings, and the code repository. You can run `list_projects` to see all monitored apps, and then check `list_deployments` to see if a recent code change is related to the `list_faults` data—all in one conversation.
The difference is context. You don't just see an error; you see the error's history, the project it belongs to, the team that owns it, and the code change that might have caused it. That's actionable intelligence.
Common Questions About Honeybadger MCP
How do I find all the active projects using the list_projects tool? +
You ask your agent to list projects. It runs list_projects and gives you a list of all monitored apps. This output includes project names, IDs, and the current count of faults and notices for each one.
What is the difference between list_faults and get_fault? +
Use list_faults to get an overview of all error groups (faults). Use get_fault when you already know the fault ID and need the complete, specific details for that single error group.
Can I use list_notices to see the full backtrace? +
No. list_notices only lists the individual error occurrences. You must run get_notice to retrieve the full backtrace, request data, and session context for a specific notice ID.
How do I check if a deployment caused the error? +
Run list_deployments to see the list of recent code revisions. You can then correlate a spike in list_faults with the revision dates to trace the potential cause.
How do I mark a fault as resolved using resolve_fault? +
Tell your agent to run resolve_fault and provide the fault ID. This changes the status of the error group, keeping your dashboard accurate for the team.
How do I check the status of team members using the list_members tool? +
The list_members tool retrieves all team members assigned to a project. You can use this data to check roles and determine who owns specific fault groups or needs to be notified about an issue.
What information does the list_sites tool provide about uptime monitoring? +
The list_sites tool gives a list of all configured uptime monitoring sites within a project. This helps you see which specific endpoints are being checked for availability and if any are failing.
When should I use the get_notice tool versus the list_notices tool? +
Use list_notices to get a list of individual error occurrences (notices) for a fault. If you know the specific notice ID, use get_notice to get all the detailed information, including the full backtrace.
Can I see the exact backtrace of an error through my agent? +
Yes. Use the get_notice tool with a specific Notice ID to retrieve the full backtrace and request data. This allows your agent to help you identify the exact line of code causing the exception.
How do I mark an error as resolved from a conversation? +
Use the resolve_fault tool by providing the Project ID and Fault ID. Your agent will update the status in Honeybadger, and you'll be notified if the same error occurs again in the future.
Can I monitor site availability using my agent? +
Absolutely. Use the list_sites tool to see all registered uptime monitoring checks. Your agent will return site names, URLs, and their current status to ensure your infrastructure is healthy.
Multi-server workflows that include Honeybadger (Error Tracking) MCP
Generate Error Postmortems Automatically via MCP
Errors captured, stack traces analyzed, root cause commits identified, postmortem docs generated , write incident reports without the pain
MCP Recipe to Fix Production Crashes Faster
Your app crashed 847 times yesterday and the error report sits in Honeybadger while your Linear board has no idea , the engineer who wrote the broken code merged a different PR today
Prioritize Errors by Revenue Impact via MCP
Two crashes happened at 3am , one affects a $500/month customer and the other affects a $180K/year enterprise account , but your PagerDuty treats them identically because error monitoring has no idea how much money is at risk
Use it with your favorite AI tools
Connect this server to Cursor, Claude, VS Code, and more.
More in this category
Scrapfly
Scrape web data at scale with a managed API that handles proxies, browser rendering, and anti-bot bypassing automatically.
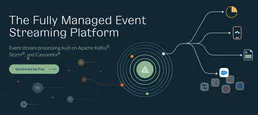
Keen
Stream events and perform powerful analytics queries via Keen.io.

Transloadit
Versatile file uploading and processing API.
You might also like

NASA Earth — Full-Disk Imagery & Natural Events
View Earth from 1.5 million km away through DSCOVR's EPIC camera (full-disk images in natural and enhanced color) and track active natural events worldwide through EONET: wildfires, volcanic eruptions, severe storms, icebergs, and more.
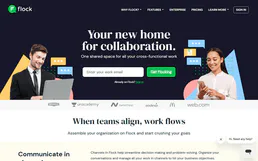
Flock
Manage team collaboration via Flock — send rich messages with FlockML, handle public channels and private groups, and search rosters directly from any AI agent.
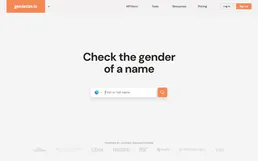
Genderize
Predict the gender of a person based on their first name via AI agents with Genderize.io.