GDACS MCP. Track live disasters & assess impact risk.
 Gemini
 Works with every AI agent you already use
…and any MCP-compatible client
Just plug in your AI agents and start using Vinkius.
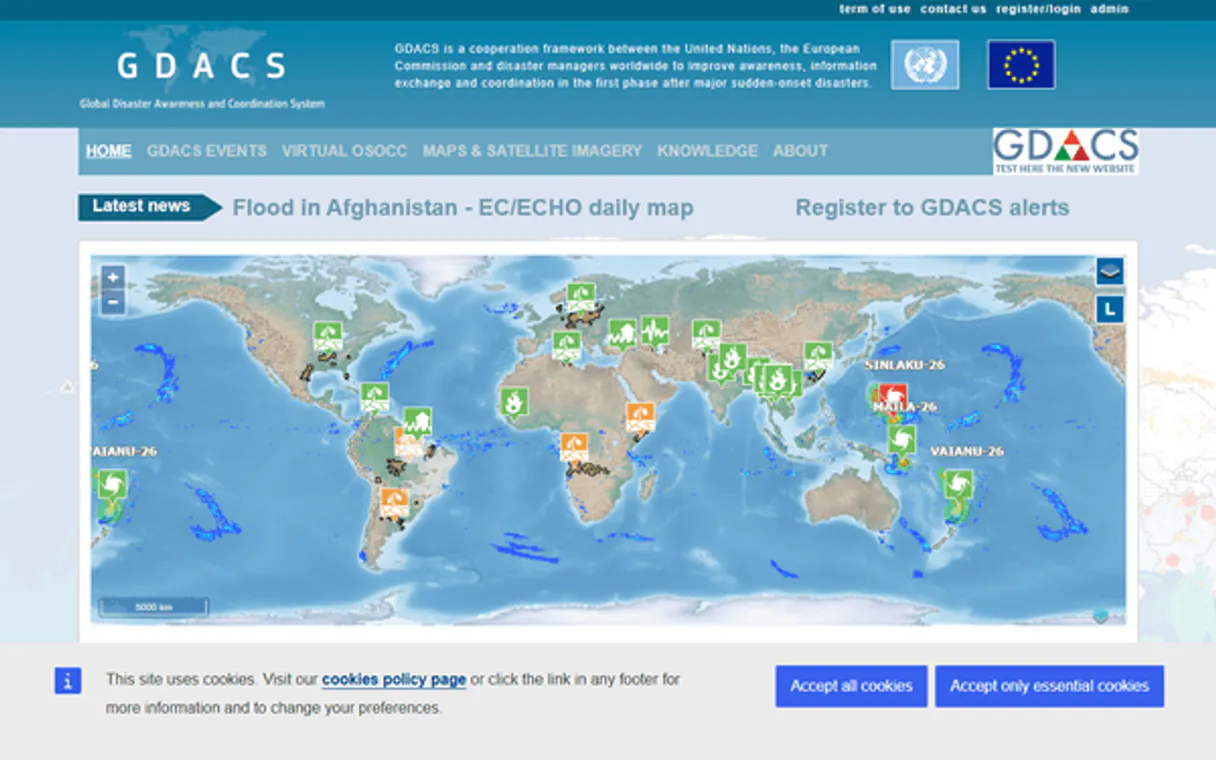
GDACS monitors global disaster activity—earthquakes, cyclones, floods, volcanoes, wildfires, and droughts—with real-time impact estimates. It pulls structured data like population exposure, estimated fatalities, and economic losses directly from the Global Disaster Alert and Coordination System.
You get categorized alerts (red/orange/green) and detailed geospatial boundaries for every event. This tool lets your AI client analyze complex, worldwide hazard data without needing an API key.
What your AI agents can do
Get alert detail
Retrieves comprehensive details for a single, specified disaster alert ID.
Get alerts
Gets a list of current alerts, showing severity (red/orange/green) and allowing filters by event type or time period.
Get event detail
Pulls full information about one specific disaster event instance.
Retrieves detailed lists and real-time updates for specific events like the latest earthquakes, cyclones, or floods.
Calculates estimated human and economic costs by retrieving population exposure, potential fatalities, and financial losses tied to a disaster event.
Returns the geographic boundaries (GeoJSON) for an entire disaster event, defining affected areas and populations.
Retrieves a filtered list of current alerts, showing immediate severity levels across different types of global hazards.
Pulls deep, granular information about one specific disaster event or alert ID when needed.
Ask AI about this MCP
Supported MCP Clients
Gemini Waiting for input…
GDACS: 12 Tools for Disaster Event Data
These tools allow your agent to analyze event details, geographic boundaries, impact metrics, alert levels, and specific hazard types across the globe.
019d843eget alert detail
Retrieves comprehensive details for a single, specified disaster alert ID.
019d843eget alerts
Gets a list of current alerts, showing severity (red/orange/green) and allowing filters by event type or time period.
019d843eget event detail
Pulls full information about one specific disaster event instance.
019d843eget event geojson
Returns the geographic boundaries and affected areas for a specified disaster event in GeoJSON format.
019d843eget event list
Searches for disaster events, filtering by type (EQ, TC, FL, etc.), date range, or time period to list names, types, and alert levels.
019d843eget impacts
Provides estimates of affected population count, fatalities, economic losses, and confidence levels for a given disaster event.
019d843eget latest cyclones
Retrieves the names, categories, wind speeds, locations, and forecast tracks for active tropical cyclones worldwide.
019d843eget latest droughts
Lists current drought events globally, including start dates, severity levels, alert status, and affected populations.
019d843eget latest earthquakes
Shows the most recent global earthquakes, reporting magnitude, depth, location, and immediate impact estimates. Filters are available by minimum size or time frame.
019d843eget latest floods
Lists active flood events globally, providing locations, start dates, alert levels, affected populations, and severity scores.
019d843eget latest volcanoes
Reports the latest volcanic activity worldwide, listing names, locations, eruption types, alert status, and ash plume data.
019d843eget latest wildfires
Tracks active wildfires globally, providing fire locations, start dates, burned area metrics, alert levels, and affected people counts.
Choose How to Get Started
Build a custom MCP for your own tools, or connect a ready-made integration from our catalog.
Build Your Own
Turn any API into an MCP. Import a spec, define Agent Skills, or deploy with MCPFusion.
- Import from OpenAPI, Swagger, or YAML specs
- Create Agent Skills with progressive disclosure
- Deploy to edge with MCPFusion framework
- Built in DLP, auth, and compliance on every call
- Real time usage dashboard and cost metering
- Publish to catalog or keep private
Make Your AI Do More
Start with GDACS, then connect any of our 4,700+ other servers whenever your AI needs more. One click, no limits.
- Use this MCP plus 4,700+ others, all in one place
- Add new capabilities to your AI anytime you want
- Every connection is secured and compliant automatically
- Track usage and costs across all your servers
- Works with Claude, ChatGPT, Cursor, and more
- New servers added to the catalog every week
What you can do with this MCP connector
You gotta know what’s happening when disaster strikes, globally. This server connects your AI client straight into the Global Disaster Alert and Coordination System (GDACS), letting you pull real-time hazard data without needing to mess with any API keys or complex credentials. It's a direct feed of structured world crisis info.
To track global hazards, you can get immediate updates on specific events. You’ll find get_latest_earthquakes, which shows the most recent quakes worldwide; it reports magnitude, depth, location, and even preliminary impact estimates, letting you filter by minimum size or a date range. If there are tropical cyclones out there—hurricanes or typhoons—you can use get_latest_cyclones to pull names, categories, wind speeds, locations, and the whole forecast track.
For floods, get_latest_floods lists active events globally, giving you locations, start dates, alert levels, affected population numbers, and severity scores. Volcanoes aren't exempt; get_latest_volcanoes reports current activity worldwide, listing names, locations, eruption types, alert status, and the data on ash plumes. You can track wildfires with get_latest_wildfires, which gives you fire locations, start dates, burned area metrics, alert levels, and how many people are affected.
And if drought is hitting a region, get_latest_droughts lists those events globally, tracking severity levels, alert status, and the populations impacted. For earthquakes alone, you can also run get_event_list, which searches for disaster events across types like EQ, TC, or FL, letting you filter by date range or time period to list names, types, and current alert levels.
When you need specific event details, you’ve got a few ways. You can use get_event_detail to pull full information about one specific disaster instance. If you know the ID of an immediate warning, get_alert_detail retrieves all the deep, granular details for that single alert. To check the overall status of different kinds of warnings, get_alerts gives you a list of current alerts, showing severity—red, orange, or green—and letting you filter by event type or time period.
You can also run get_event_list to search for events and get their names, types, and alert levels.
To understand the full scope of any given disaster, you calculate its impact using get_impacts. This tool provides estimates for affected population count, potential fatalities, economic losses, and confidence levels tied directly to a specific event. For mapping out exactly where the damage is, run get_event_geojson; this returns the geographic boundaries and affected areas for any specified disaster event in GeoJSON format.
You can also pull all current alerts using get_event_geojson, which helps map the boundaries of an entire disaster event.
To summarize the data retrieval process: you start by getting a list of events, then narrow down to specific details, and finally calculate the impact or visualize the area. For example, if you're dealing with a flood, you first get a general list via get_event_list, then pull its full info using get_event_detail.
Next, you can run get_impacts on that event to see the numbers and use get_event_geojson to map out the exact affected boundaries. The mechanism is built for deep data dives: if you need a single alert's history, use get_alert_detail; if you just want to know what major events are happening right now across all types, run get_alerts.
You never gotta worry about missing key data points because the server covers every facet of hazard response.
You can’t get around the specialized tracking. If you're focused purely on tropical cyclones, get_latest_cyclones handles it; if you need drought metrics, you use get_latest_droughts. The tools work together: getting a list of earthquakes via get_latest_earthquakes gives you enough info to then run get_impacts and see the projected losses for that quake.
This means your agent doesn't just check boxes; it builds out a full, actionable picture from raw global data. You'll never have to stitch together multiple APIs or worry about incompatible data formats because this whole system is designed to feed structured hazard information directly into your workflow.
How GDACS MCP Works
- 1 First, connect your AI client to the GDACS MCP Server. You don't need any API keys.
- 2 Next, prompt your agent with a query, such as 'What were the largest floods in Southeast Asia last quarter?'
- 3 The system calls specific tools (e.g.,
get_event_listthenget_latest_floods), which returns structured data, impact metrics, and alert status to your client.
The bottom line is: You ask for the disaster information you need, and the server executes the complex data calls automatically.
Who Is GDACS MCP For?
Emergency managers who are tired of piecing together status reports from disparate dashboards. Field operatives needing immediate risk assessments in a crisis zone. Researchers studying long-term climate patterns, and insurance professionals modeling catastrophe risk.
Monitors real-time disaster alerts across multiple fronts to coordinate rapid response efforts.
Analyzes historical data sets and tracks patterns in event frequency, impact severity, and population exposure over years.
Assesses the potential financial damage from various natural hazards by modeling estimated losses using specific tools like get_impacts.
What Changes When You Connect
- Get immediate status updates on multiple hazard types. Instead of checking separate sites for quakes, cyclones, and floods, you can run
get_alertsto see them all in one query. - Analyze financial risk with precision. Use the
get_impactstool to calculate estimated economic losses and potential fatalities for any event, which is critical for insurance modeling. - Visualize affected areas instantly. The
get_event_geojsontool returns precise geographic boundaries, allowing you to map population exposure directly onto a GIS platform. - Monitor the biggest threats first. Tools like
get_latest_earthquakes,get_latest_cyclones, andget_latest_wildfiresgive you immediate data on the most active global threats without digging through archives. - Filter massive datasets easily. You can use
get_event_listto narrow down results, checking for only 'EQ' events between two dates, or focusing solely on 'FL' alerts in a region.
Real-World Use Cases
Post-Quake Damage Assessment
An insurance analyst needs to know the potential payout area after an earthquake. They prompt their agent: 'Find all M6+ quakes in Puerto Rico last month.' The agent uses get_latest_earthquakes then runs get_impacts on the results, returning estimated fatalities and economic loss data for a quick risk report.
Tracking Cyclone Movement
A humanitarian worker needs to advise local teams. They ask: 'What are the current cyclone threats in the Pacific?' The agent uses get_latest_cyclones and immediately provides category, wind speed, and affected population data for rapid resource deployment.
Mapping Flood Boundaries
A city planner needs to understand how much land was impacted by a recent flood. They ask the agent for the boundaries of the event, triggering get_event_geojson. This returns precise polygons that can be overlaid onto municipal zoning maps.
Comparing Hazard Severity
A government official needs to brief leadership on all current risks. They prompt: 'Give me a comparison of the top three active threats.' The agent calls get_alerts, which synthesizes data from volcanoes, floods, and quakes into one color-coded status report.
The Tradeoffs
Searching for vague disaster terms
Just asking the AI: 'Tell me about disasters.' The agent will struggle because it doesn't know which tool or filter to apply, returning a generic failure message.
→
Be specific and use filtering keywords. Instead of general queries, ask: 'Search for flood events in Vietnam between May 1st and June 15th using get_event_list.' This focuses the search immediately.
Trying to calculate impact manually
Receiving a list of event names from one tool, then having to copy those names into another interface to find population data. This is slow and error-prone.
→
Use the get_impacts tool directly after identifying an event using get_event_list. You give it the event ID or type, and it returns the full impact metrics in one go.
Assuming all data is current
Relying on old reports because you didn't specify a time window. Data can be stale if not scoped correctly.
→
Always scope your request with the date or timeframe. For example, 'Show me earthquakes in the last 7 days,' which triggers get_latest_earthquakes and limits the search automatically.
When It Fits, When It Doesn't
Use this server if your workflow requires synthesizing data from multiple global risk vectors—meaning you need to compare current flood levels alongside recent volcanic activity or assess both wildfire spread and earthquake impact. This is for high-level situational awareness.
Don't use it if you only need basic, general news reporting; there are simpler search tools for that. Also, don't rely on this server to predict future events—it reports based on existing alerts and historical data (like get_event_list). If you just need a simple list of today’s headlines, use a standard news API instead. Use the specific 'latest' tools (like get_latest_cyclones) when your priority is only one type of hazard, because they are faster than running a full search like get_alerts.
Independent Platform Disclaimer: Vinkius is an independent platform and is not affiliated with, endorsed by, sponsored by, verified by, or otherwise authorized by GDACS. All third-party trademarks, logos, and brand names are the property of their respective owners. Their use on this website is strictly for informational purposes to identify service compatibility and interoperability.
VINKIUS INFRASTRUCTURE
Cloud Hosted
Managed infra
V8 Isolated
Sandboxed per request
Zero-Trust Proxy
No stored credentials
DLP Enforced
Policy on every call
GDPR Compliant
EU data residency
Token Compression
~60% cost reduction
Works with Claude, ChatGPT, Cursor, and more
The Model Context Protocol standardizes how applications expose capabilities to LLMs. Instead of operating in isolation, your AI gains direct access to external platforms, live data, and real-world actions through secure, standardized connections.
This server provides 12 capabilities that interface natively with Claude, ChatGPT, Cursor, and any MCP client. No middleware. No custom integration required.
Available Capabilities
Monitoring global crises shouldn't feel like checking five different government websites.
Today, assessing a potential disaster requires manual juggling. You check the USGS site for earthquakes, then flip tabs to NOAA for cyclones, and finally visit FEMA for flood alerts. You end up with scattered data points, making it nearly impossible to synthesize a single risk picture.
With GDACS, your agent pulls all that information into one conversation thread. You can ask about 'tropical cyclone impacts' and get the wind speed, alert level, *and* estimated affected population—all without leaving the chat window.
GDACS MCP Server: Get geo-spatial boundaries with `get_event_geojson`
Before this server, figuring out the exact physical scope of a disaster—the actual affected land area for a volcano or wildfire—meant downloading massive files and using specialized GIS software. It was slow, and it required expert setup.
Now you just ask for the GeoJSON data via `get_event_geojson`. The server returns clean, structured geometry that your client can immediately use to plot boundaries across any map interface.
Common Questions About GDACS MCP
How do I check all active disaster alerts using get_alerts? +
You prompt the agent with 'Show me current global alerts.' The get_alerts tool returns a color-coded list, allowing you to filter by event type or time period instantly.
What data does get_impacts provide for an event? +
get_impacts gives you the full picture of consequences: estimated population affected, potential fatalities, economic losses, and a confidence level for all metrics.
How do I find historical records with get_event_list? +
Use get_event_list by specifying the event type (e.g., EQ=earthquake) and the date range you are interested in. It returns names, types, magnitudes, and alert levels for that period.
Does get_event_geojson only give coordinates? +
No, get_event_geojson provides much more than just points; it returns the full geographic boundaries, affected areas, and population exposure polygons in GeoJSON format.
Does running `get_latest_earthquakes` require me to manage API keys or credentials? +
No, you don't need to worry about setting up or managing any API keys. The server connects directly via the MCP protocol using your AI client's existing connection permissions.
When I call `get_event_geojson`, what exactly does it return besides just basic boundary outlines? +
It returns comprehensive polygons defining the event’s physical scope. This includes specific data points for affected zones, geographic boundaries, and population density exposure overlays.
Can I filter results using `get_event_list` by multiple criteria (e.g., magnitude AND date range)? +
Yes, you specify multiple parameters in the request payload. You can combine filtering by event type (like EQ or FL) with a custom date range to narrow your search effectively.
If I call `get_alerts` repeatedly in quick succession, are there rate limitations I should be aware of? +
The Vinkius Marketplace manages the connection for typical usage. For industrial-scale batch processing, check the service’s dedicated documentation for specific throughput guidelines.
Do I need an API key? +
No! GDACS data is completely free and open. No authentication required. Just subscribe and start monitoring disasters.
What do the alert levels mean? +
GDACS uses three alert levels: Green (low impact, local effects), Orange (medium impact, significant regional effects), Red (high impact, potentially catastrophic with international response needed).
How far back can I search for events? +
You can search events from the past 1 to 30 days using the period or date_from/date_to parameters. For historical analysis, use date_from and date_to with specific dates.
Use it with your favorite AI tools
Connect this server to Cursor, Claude, VS Code, and more.
More in this category

Clash of Clans Strategy & War Analytics
The definitive server for Clash of Clans — track clan wars, player progress, and global rankings via AI.

LandTech
Research land ownership, planning applications, and property development opportunities with geospatial intelligence tools.

Databox
Visualize KPIs from hundreds of data sources in custom dashboards that keep your entire team focused on what matters.
You might also like
USDA NASS
Access US agricultural statistics via USDA NASS — query crop yields, livestock data, farm economics and demographics from any AI agent.

Amazon Marketing Cloud
Advanced advertising analytics — execute SQL queries and monitor workflows via AI.
SparkPost
Bring your SparkPost email delivery platform into your AI. Manage templates, send campaigns, and audit deliverability directly from your editor.