01
MCP Server
Sentry MCP Server
Raw exception tracking. Stack traces and crash contexts without the noise.
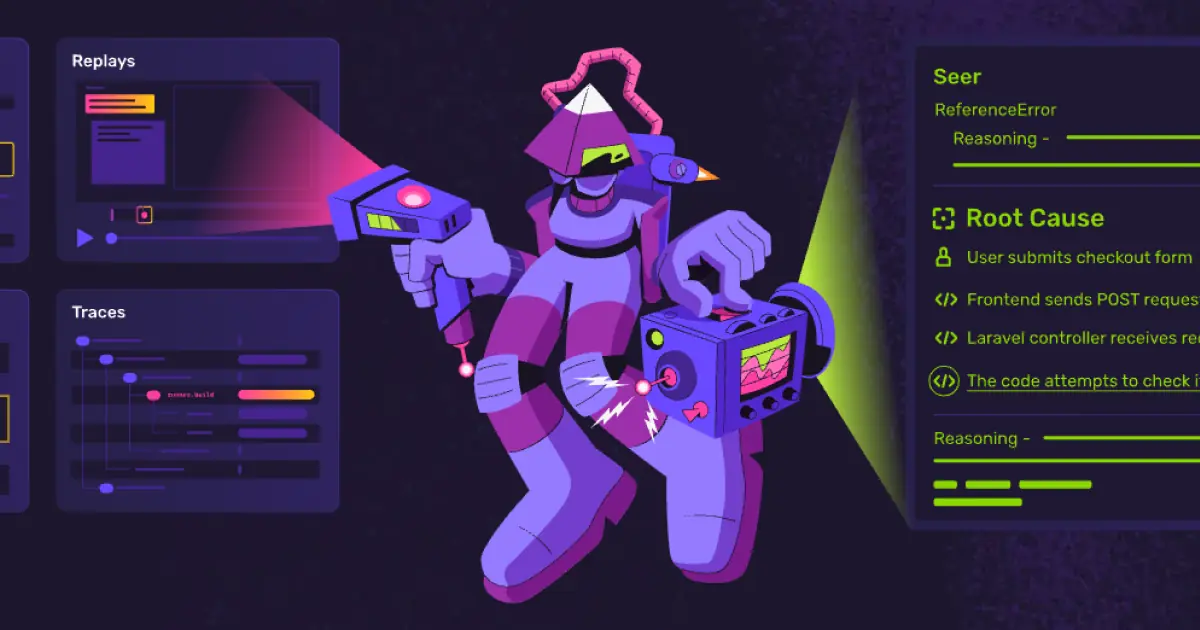
sentry.ioLook, unhandled exceptions kill reliability. This MCP Server gives your agents raw execution context against your Sentry projects. They can pull stack traces, map failing commits, and resolve issues without touching the UI. —Signal through the noise—your AI triages the exact line of failing code, exactly how an incident commander would.
Issue queries with stack trace context
Release health & regression tracking
Error resolution & assignment workflows