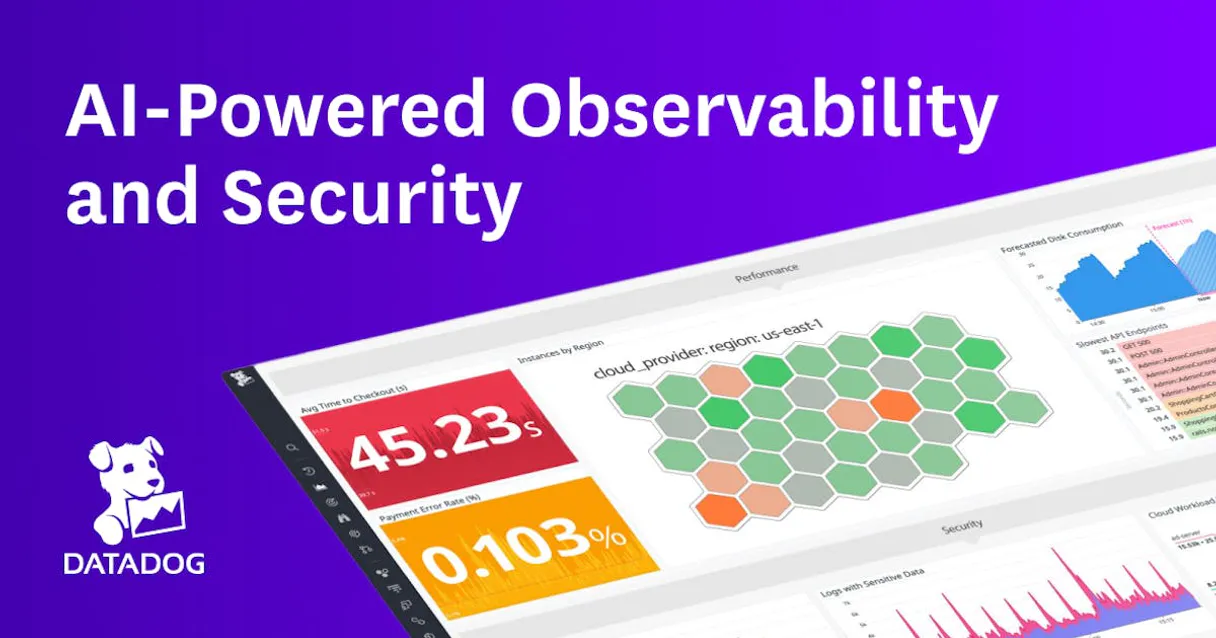
Datadog MCP, Ready to Go
Query performance metrics and search logs using AI agents with the Datadog MCP. Connect your account to Claude or Cursor today.
No credit card required. Experience the power of this integration risk-free.
Query performance metrics and search logs across your cloud infrastructure.
Works with every AI agent you already use
…and any MCP-compatible client
How fast is the Datadog Connector?
Average time for the server to become ready for requests over the last 7 days, measured until the initialize / tools/list handshake completes. Metrics are updated daily between 00:00 and 04:00 UTC. Create a free account, use this Connector on Vinkius Cloud, and connect it to your AI agent in seconds.
Waiting for input…
What AI agents can do with Datadog 11 Tools for Infrastructure Monitoring
Use these tools to query metrics, search logs, and manage monitors via your AI agent.
List dashboards
Get a list of all your dashboard IDs and titles. This helps you find the right visualization quickly.
Query metrics
Pull time-series data for specific infrastructure or app metrics. Use it to see how CPU or memory usage changes over time.
List downtimes
See planned maintenance windows and their current status. This helps you avoid chasing ghost issues during scheduled work.
List slos
View your Service Level Objectives and their current compliance. Use it to see if your app is meeting its uptime targets.
Search logs
Find specific log entries that match your query. It's great for spotting errors or specific status codes across your apps.
List monitors
See all your monitors and their current states like alert or ok. This gives you a quick overview of your system health.
Get monitor
Get the full details of a specific monitor, including its thresholds. Use it to understand exactly why a monitor is firing.
Mute monitor
Silence a specific monitor for a set period. This is perfect for ignoring known issues during maintenance.
List events
Pull a list of events like alerts and deployment logs. Use it to see what happened in your environment recently.
Get dashboard
See the full configuration and widgets for a specific dashboard. This helps you understand how a dashboard is built.
List hosts
Get a list of your infrastructure hosts and their tags. Use it to see which cloud resources are currently active.
A Connector is a URL. Vinkius runs it: hosting, security, governance, observability.
You're looking at one of 5,800+ managed Connectors. The real value isn't the catalog. It's the control plane that secures, governs, audits, and manages every interaction between your agents and the tools they use.
No Shadow AI
Every agent action is visible, approved, and auditable. Nothing runs outside your governance.
Absolute agent control
Fine-grained permissions for every agent, MCP, and tool. Instantly revoke access and audit every execution.
Cost control per token
Spend broken down to the token, tool, and agent. Budgets and hard limits. No surprise invoices.
Managed & monitored infra
We operate the runtime, authentication, scaling, retries, and monitoring. Your team manages AI, not infrastructure.
Data protection, DLP by design
Sensitive data is filtered before reaching the model. Access is governed so agents receive only the information they're allowed to use.
Token optimization, real savings
Lower AI costs by delivering the right context instead of unnecessary tools. Better accuracy, faster responses, and fewer wasted tokens.
Datadog Infrastructure Monitoring and Log Analysis
The DevOps engineer who's tired of clicking through dozens of dashboards at 2am to find a single spike. The developer who needs to see logs without switching windows.
DevOps Engineer
Audits alerts and checks system health during active incidents without leaving the chat.
Software Developer
Searches application logs for 500 errors while debugging features in the IDE.
SRE
Monitors active alerts and tracks performance trends during high-pressure response windows.
System Admin
Verifies monitor configurations and host attributes through natural language queries.
Frequently Asked Questions
Can I use the Datadog MCP to see my server health? +
Yes, you can check your system health by asking the agent to list monitors or query specific metrics. It gives you a real-time look at what's running and what's failing.
How do I connect my Datadog account to my AI agent? +
You'll need your Datadog API Key, APP Key, and Site. Once you provide those to your AI client, the agent can start querying your infrastructure.
Can it help me find specific errors in my logs? +
Yes, it can search logs using specific queries. You can ask for logs containing specific error codes, status levels, or structured attributes.
Can I silence alerts using this Connector? +
Yes, you can use the mute_monitor tool to silence specific monitors for set periods. This is great for ignoring known issues during maintenance.
Does this Connector work for cloud infrastructure? +
Yes, it works with any host or service you have in Datadog, including cloud provider attributes and agent versions.
Can I see my SLO status? +
Yes, you can ask the agent to list your Service Level Objectives. It will return your target percentages, time windows, and current compliance status.
Can my agent query specific Datadog metrics using DDQL? +
Yes. Use the 'query_metrics' tool. Provide your DDQL query string and the target time range. The agent will fetch the numeric timeseries data directly from Datadog's telemetry datastores.
How do I search for a specific error message across my application logs? +
Use the 'search_logs' tool. Provide a query matching your error string and an ISO time boundary. The agent will retrieve the structural extraction of logs matching those parameters to help you identify failures.
Can I see which monitors are currently in an alert state? +
Absolutely. The 'list_monitors' tool allows you to filter by group state (e.g., 'alert,warn'). The agent pulls the explicitly configured system triggers to show you which services are currently unhealthy.
Your AI, connected to everything.


No credit card required · Free tier available


Other Connectors in this category
ArcGIS Connector
Access GIS services via ArcGIS. Geocode addresses, search places, get routes, check elevation and discover basemap styles from any AI agent.
Zoho ZeptoMail Connector
Zoho ZeptoMail MCP lets you send transactional emails and monitor delivery health through your AI agent. Send password resets, service alerts, or custom HTML emails using pre-defined templates. Check logs, verify domains, and manage suppression lists without leaving your AI interface.
Azure Service Bus Topic Connector
This Connector does exactly one thing: it publishes messages to a single Azure Service Bus Topic. That's its only function, and nothing else. Incredible for giving your AI the power to trigger cloud events.
Related Connectors
Mirror.xyz (Web3 Publishing Platform) Connector
Access and read decentralized publications on Mirror.xyz. Fetch publication entries and retrieve full content via ENS domains and Arweave digests.
Storylane Connector
Interactive, personalized product demos.
BLS JOLTS — Job Openings, Quits & Turnover Connector
Deep-dive into the 'Great Resignation' and labor tightness with the US Job Openings and Labor Turnover Survey (JOLTS). Track hires, fires, and voluntary quits.
Powerful workflows with this Connector
Get Instant Incident Alerts in Discord via MCP
Monitors fire, Discord gets the alert, the incident log updates itself , no human in the loop
MCP Recipe for Full-Stack Observability
Two monitoring tools, zero correlation , your Datadog alerts say 'high latency' and your Grafana dashboards say 'database connections maxed' but nobody connected the dots until the postmortem
MCP Recipe for Pre-Mortem System Analysis
Architecture red-teamed, failure modes quantified, monitoring alerts created , pre-mortem your system before production breaks it
Connectors for Cache Performance Monitoring
Your Redis cache has 47,000 keys but only 3,200 are ever accessed , the rest are ghosts from features you deleted 6 months ago, silently eating memory and money
Connectors for Monitored Deploy Orchestration
PR merged, deployment triggered, health check passed , and the deploy summary posted itself to the PR thread
Connectors to Find Your Most Expensive APIs
API traffic metered, cache savings calculated, origin load measured, cost projections generated , optimize your API infrastructure costs with data