DigitalOcean MCP. Audit Droplets, Databases, and Networking in Chat
 Gemini
 Works with every AI agent you already use
…and any MCP-compatible client
Just plug in your AI agents and start using Vinkius.
DigitalOcean MCP Server equips your AI agent to manage cloud infrastructure. It lets you track Droplets, list block storage, monitor managed databases (Postgres, MySQL, Redis), and audit network rules—all through conversation.
Use it to check resource status, find IP addresses, or get metadata on your entire cloud setup without logging into the console.
What your AI agents can do
Get account metadata
Retrieves high-level limits and metadata for your DigitalOcean account.
Get droplet details
Gets deep, specific configuration information for one particular Droplet.
List app platform services
Lists every application deployed on the DigitalOcean App Platform.
Retrieves specific configuration and status data for a single compute instance (Droplet).
Generates a list of every Droplet in your account, including their current status and IP addresses.
Lists all block storage volumes and lets you review DNS domains managed within your account.
Lists all managed database clusters (Postgres, MySQL, Redis) and provides their technical metadata.
Lists all logical projects and shows you the rules for any cloud firewalls attached to your infrastructure.
Searches for a Droplet by name keyword to quickly pull up its status and details.
Ask AI about this MCP
Supported MCP Clients
Gemini Waiting for input…
DigitalOcean MCP Server: 10 Tools for Cloud Ops
Use these ten tools to list, audit, and retrieve detailed information about every compute, storage, and network resource in your DigitalOcean account.
019d7586get account metadata
Retrieves high-level limits and metadata for your DigitalOcean account.
019d7586get droplet details
Gets deep, specific configuration information for one particular Droplet.
019d7586list app platform services
Lists every application deployed on the DigitalOcean App Platform.
019d7586list block storage volumes
Lists all attached block storage volumes across your account.
019d7586list cloud firewalls
Lists all cloud firewalls and the rules defined within them.
019d7586list cloud projects
Lists all logical projects you use to group your cloud resources.
019d7586list compute droplets
Lists every compute instance (Droplet) in your account.
019d7586list dns domains
Lists all DNS domains managed within DigitalOcean.
019d7586list managed databases
Lists all managed database clusters, including Postgres, MySQL, and Redis.
019d7586search droplets by name
Searches for a Droplet using a keyword name to pull up its specific details.
Choose How to Get Started
Build a custom MCP for your own tools, or connect a ready-made integration from our catalog.
Build Your Own
Turn any API into an MCP. Import a spec, define Agent Skills, or deploy with MCPFusion.
- Import from OpenAPI, Swagger, or YAML specs
- Create Agent Skills with progressive disclosure
- Deploy to edge with MCPFusion framework
- Built in DLP, auth, and compliance on every call
- Real time usage dashboard and cost metering
- Publish to catalog or keep private
Make Your AI Do More
Start with DigitalOcean, then connect any of our 4,700+ other servers whenever your AI needs more. One click, no limits.
- Use this MCP plus 4,700+ others, all in one place
- Add new capabilities to your AI anytime you want
- Every connection is secured and compliant automatically
- Track usage and costs across all your servers
- Works with Claude, ChatGPT, Cursor, and more
- New servers added to the catalog every week
What you can do with this MCP connector
Your AI agent can manage your whole DigitalOcean cloud setup. You'll get the status and deep details for any Droplet, list every Droplet you've got running with their current status and IP addresses, and search for a specific Droplet using just a keyword name to pull up its status and details.
You can list all attached block storage volumes and review every DNS domain managed in your account. You'll also see a list of all logical projects you use to group your cloud resources and review the rules for any cloud firewalls attached to your infrastructure. You'll get a rundown of all managed database clusters, including Postgres, MySQL, and Redis, along with their technical metadata.
To check your account limits and overall metadata, you can retrieve high-level information for your DigitalOcean account. You'll also see every application deployed on the DigitalOcean App Platform, and you can list all compute instances (Droplets) in your account.
How DigitalOcean MCP Works
- 1 Connect the DigitalOcean integration to your AI client and provide the necessary Personal Access Token.
- 2 Ask your agent for a specific action, like 'List all Droplets with IP addresses.'
- 3 The agent calls the relevant tool(s) and returns the consolidated resource data to you.
The bottom line is, your agent handles the API calls and data formatting, so you just talk to it.
Who Is DigitalOcean MCP For?
The ops engineer who's tired of clicking through dashboards at 2am. This is for Cloud Architects and DevOps Engineers who need a quick, conversational way to audit complex infrastructure. If you spend time manually checking resource dependencies, this saves you time.
Checks Droplet status and network configs on the fly. They use the server to quickly audit resource allocation or check firewall rules during an incident.
Monitors resource health and database metadata via chat. They use it to map out resource dependencies or review project boundaries.
Audits cloud projects and firewall rules during maintenance. They use it to verify resource grouping or check for unauthorized network changes.
What Changes When You Connect
- Check Droplet status and IP addresses instantly. Use
list_compute_dropletsto see all running instances, orsearch_droplets_by_nameif you know the name. This avoids the console dashboard clutter. - Audit your entire network stack. Use
list_dns_domainsto see all managed names, andlist_cloud_firewallsto check the rules. You get a clear view of what's exposed. - Track database health without logging into a separate dashboard.
list_managed_databasesshows you Postgres, MySQL, and Redis clusters and their metadata. - See all your deployed apps and resources.
list_app_platform_serviceslists everything on the App Platform, whilelist_block_storage_volumesdetails your attached storage. - Understand your resource boundaries. Use
list_cloud_projectsto see how resources are grouped, andlist_account_metadatato check your account's overall usage limits. - Drill down on specific machines.
get_droplet_detailslets you pull the full spec for one Droplet, so you don't have to scroll through pages of data.
Real-World Use Cases
The App is Slow: Checking for Resource Exhaustion
The app fails intermittently. The agent first runs list_compute_droplets to confirm if the Droplets are running. Then, it runs list_block_storage_volumes to check if storage is maxed out. Finally, it checks list_managed_databases to see if the database cluster is reporting connection limits. The root cause is identified as the database hitting a connection threshold.
Networking Audit Before Deployment
A new service needs to go live, but the team isn't sure about firewall rules. The agent runs list_cloud_firewalls to see the current ruleset. It then runs list_dns_domains to verify the required CNAME records are set. This confirms the network path is clear before any code is pushed.
Finding the Right Server for a Client
A client asks for a server with specific specs. Instead of guessing, the agent uses search_droplets_by_name to narrow down the available machines. It then uses get_droplet_details to verify the exact CPU, RAM, and disk size for that specific machine.
Reviewing Project Dependencies
The team needs to know which resources belong to which logical grouping. The agent starts by calling list_cloud_projects to get the list of projects. Then, it uses list_compute_droplets and list_block_storage_volumes to map which resources fall under which project boundaries.
The Tradeoffs
Over-relying on a Single List Call
Asking only for 'all Droplets' (list_compute_droplets) and assuming the output has everything. You'll miss volumes, firewall rules, or DNS settings that are critical to the failure.
→
Always check multiple layers. Start with list_cloud_projects to scope the issue, then use list_compute_droplets for the machine status, and finally list_cloud_firewalls to check the network rules affecting it.
Assuming Everything is Online
Seeing a Droplet listed as 'Active' and assuming the database connection works. The database might be listed separately and might have a connectivity issue.
→
Don't stop at the compute layer. Check list_managed_databases next. Use the database's specific metadata to verify its connection status and version before declaring the service live.
Skipping the Networking Check
The application fails, so you check the code. But the real issue is a firewall rule blocking traffic. You wasted hours debugging the wrong layer.
→
Check the network first. Run list_cloud_firewalls to see the rules, and then run list_dns_domains to confirm the domain records point correctly. This catches network blockers immediately.
When It Fits, When It Doesn't
Use this if you need to audit the entire stack—from networking down to the application state. You need to know how components relate: Does the Droplet's IP match the firewall rule? Does the database cluster belong to the correct project? If your problem requires checking dependencies between compute, storage, and network rules, this server is essential. Don't use it if you only need to check one thing, like a single database status. For that, just use the database's dedicated tool. The goal is total visibility.
Independent Platform Disclaimer: Vinkius is an independent platform and is not affiliated with, endorsed by, sponsored by, verified by, or otherwise authorized by DigitalOcean. All third-party trademarks, logos, and brand names are the property of their respective owners. Their use on this website is strictly for informational purposes to identify service compatibility and interoperability.
VINKIUS INFRASTRUCTURE
Cloud Hosted
Managed infra
V8 Isolated
Sandboxed per request
Zero-Trust Proxy
No stored credentials
DLP Enforced
Policy on every call
GDPR Compliant
EU data residency
Token Compression
~60% cost reduction
Works with Claude, ChatGPT, Cursor, and more
The Model Context Protocol standardizes how applications expose capabilities to LLMs. Instead of operating in isolation, your AI gains direct access to external platforms, live data, and real-world actions through secure, standardized connections.
This server provides 10 capabilities that interface natively with Claude, ChatGPT, Cursor, and any MCP client. No middleware. No custom integration required.
Available Capabilities
Sifting through cloud dashboards for basic resource status is a massive time sink.
Today, checking a resource means clicking into the console, navigating to 'Compute,' finding the Droplets list, copying the IP, then switching tabs to 'Networking' to check the firewall rules, and finally switching again to 'Databases' to verify the cluster status. It's a mess of clicks and tab-switching.
With the DigitalOcean MCP Server, you just ask your agent: 'What's the status of my web app?' The agent calls `list_compute_droplets`, then `list_cloud_firewalls`, and finally `list_managed_databases`—all in one conversational turn. You get the data, period.
DigitalOcean MCP Server: Get a full picture of your infrastructure.
You don't have to manually cross-reference which Droplets use which volumes, or which project controls which firewall. The agent handles the data gathering across `list_compute_droplets`, `list_block_storage_volumes`, and `list_cloud_projects` to give you the full picture.
You stop managing tickets and start solving problems. You get a complete, auditable snapshot of the entire cloud environment, instantly.
Common Questions About DigitalOcean MCP
How do I check the status of all my virtual machines using list_compute_droplets? +
It lists every Droplet in your account. You get a list of IPs, names, and current status (e.g., 'Active', 'Off'). If you need more detail on a specific machine, run get_droplet_details.
Can I check all my databases with list_managed_databases? +
Yes, it lists all managed database clusters (Postgres, MySQL, Redis, etc.). It also provides technical metadata, so you know the version and node count right away.
What is the difference between list_block_storage_volumes and list_compute_droplets? +
Droplets are the running virtual machines. Block volumes are the separate storage disks you can attach to a Droplet. list_block_storage_volumes shows the storage disks, while list_compute_droplets shows the compute units.
Do I need to use search_droplets_by_name for every Droplet? +
No. Use list_compute_droplets for a full overview of everything. Only use search_droplets_by_name when you already know the name and need to pull up its details quickly.
How do I check if my domain name is managed by DigitalOcean? (list_dns_domains) +
Running list_dns_domains shows all domains attached to your account. This confirms ownership and lists all associated records.
How do I check all the rules for my firewalls using list_cloud_firewalls? +
It lists all cloud firewalls and their rules. You get a comprehensive view of what traffic is allowed or blocked across your project.
What is the difference between list_cloud_projects and list_compute_droplets? +
list_cloud_projects shows the logical grouping of resources. list_compute_droplets specifically lists the actual running compute instances (Droplets) within those projects.
How do I list all the apps I've deployed using list_app_platform_services? +
It returns a list of all deployed applications on the App Platform. You can see the current status and last deployment time for each service.
How do I get a DigitalOcean Personal Access Token? +
Log in to your DigitalOcean account, navigate to the API section in the sidebar, and under the Tokens/Keys tab, click Generate New Token. Ensure you select the 'read' or 'write' scopes as needed.
Can the agent reboot a Droplet? +
This integration currently focuses on listing and auditing infrastructure resources. Power actions like rebooting or resizing should be managed via the DigitalOcean control panel or CLI.
Is the App Platform supported? +
Yes, you can use the list_app_platform_services tool to monitor your applications deployed on DigitalOcean's App Platform and check their current deployment status.
Use it with your favorite AI tools
Connect this server to Cursor, Claude, VS Code, and more.
More in this category
Tencent CloudBase / 腾讯云开发 TCB
China's dominant serverless platform — orchestrate cloud functions, databases, and storage via AI.

NVIDIA API Catalog
Cloud Engine proxy running native foundational completions natively utilizing active Nemotron and Llama3 architectures.

iFood
AI food delivery: manage orders, menus, and restaurant operations via agents.
You might also like

Open Food Facts API
Search food products — audit nutrition, barcode, and categories via AI.

ElevenLabs Alternative
Generate lifelike speech, clone voices, and create sound effects using ElevenLabs' industry-leading AI audio technology.
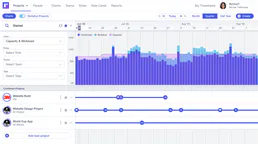
Runn
Connect your AI to Runn for complete visibility into project pipelines, capacity planning, resource allocations, and timesheet actuals directly via chat.