Bring Data Visualization
to LlamaIndex
Learn how to connect ImageCharts to LlamaIndex and start using 10 AI agent tools in minutes. Fully managed, enterprise secure, and ready to use without writing a single line of code.
Compatible with every major AI agent and IDE
 Gemini
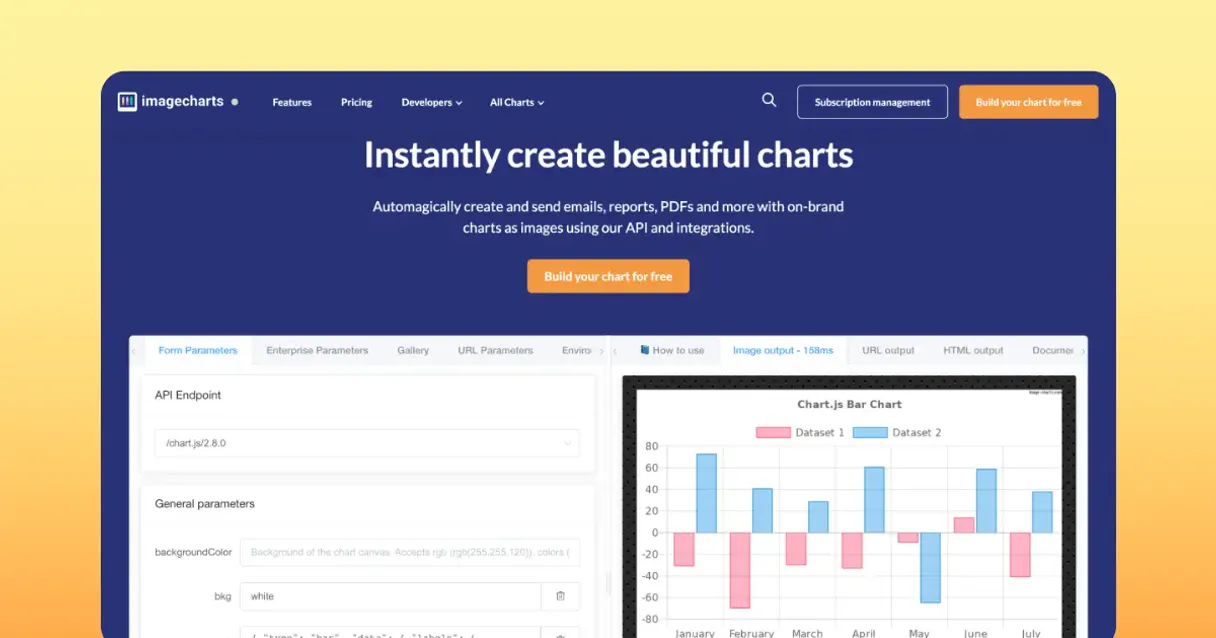
What is the ImageCharts MCP Server?
Connect ImageCharts to any AI agent and generate data visualizations through natural conversation.
What you can do
- Bar Charts — Generate vertical/horizontal bar charts with custom colors, labels, and data series
- Pie Charts — Create pie and doughnut charts with percentage labels
- Line Charts — Build trend charts with multiple data series and markers
- Radar Charts — Generate radar/spider charts for multi-dimensional comparisons
- Bubble Charts — Create scatter/bubble visualizations with size encoding
- QR Codes — Generate scannable QR codes from any text or URL
How it works
- Subscribe to this server
- Optionally enter your ImageCharts API Key for watermark-free output
- Start generating charts from Claude, Cursor, or any MCP-compatible client
Who is this for?
- Data Analysts — generate quick visualizations for reports and presentations
- Developers — embed chart images in applications, emails, or dashboards
- Marketing — create data-driven visuals for campaigns and social media
Built-in capabilities (10)
Generate a bar chart image
Generate a bubble chart image
Generate a doughnut chart image
Generate a line chart image
Generate a pie chart image
Generate a polar area chart image
Generate a QR code image
Generate a radar chart image
Generate a scatter plot image
Generate a Venn diagram image
Why LlamaIndex?
LlamaIndex agents combine ImageCharts tool responses with indexed documents for comprehensive, grounded answers. Connect 10 tools through Vinkius and query live data alongside vector stores and SQL databases in a single turn. ideal for hybrid search, data enrichment, and analytical workflows.
- —
Data-first architecture: LlamaIndex agents combine ImageCharts tool responses with indexed documents for comprehensive, grounded answers
- —
Query pipeline framework lets you chain ImageCharts tool calls with transformations, filters, and re-rankers in a typed pipeline
- —
Multi-source reasoning: agents can query ImageCharts, a vector store, and a SQL database in a single turn and synthesize results
- —
Observability integrations show exactly what ImageCharts tools were called, what data was returned, and how it influenced the final answer
ImageCharts in LlamaIndex
ImageCharts and 4,000+ other MCP servers. One platform. One governance layer.
Teams that connect ImageCharts to LlamaIndex through Vinkius don't need to source, host, or maintain individual MCP servers. Every tool call runs inside a hardened runtime with credential isolation, DLP, and a signed audit chain.
Raw MCP | Vinkius | |
|---|---|---|
| Server catalog | Find and host yourself | 4,000+ managed |
| Infrastructure | Self-hosted | Sandboxed V8 isolates |
| Credential handling | Plaintext in config | Vault + runtime injection |
| Data loss prevention | None | Configurable DLP policies |
| Kill switch | None | Global instant shutdown |
| Financial circuit breakers | None | Per-server limits + alerts |
| Audit trail | None | Ed25519 signed logs |
| SIEM log streaming | None | Splunk, Datadog, Webhook |
| Honeytokens | None | Canary alerts on leak |
| Custom domains | Not applicable | DNS challenge verified |
| GDPR compliance | Manual effort | Automated purge + export |
Why teams choose Vinkius for ImageCharts in LlamaIndex
The ImageCharts MCP Server runs on Vinkius-managed infrastructure inside AWS — a purpose-built runtime with per-request V8 isolates, Ed25519 signed audit chains, and sub-40ms cold starts. All 10 tools execute in hardened sandboxes optimized for native MCP execution.
Your AI agents in LlamaIndex only access the data you authorize, with DLP that blocks sensitive information from ever reaching the model, kill switch for instant shutdown, and up to 60% token savings. Enterprise-grade infrastructure, zero maintenance.
* Every MCP server runs on Vinkius-managed infrastructure inside AWS - a purpose-built runtime with per-request V8 isolates, Ed25519 signed audit chains, and sub-40ms cold starts optimized for native MCP execution. See our infrastructure
How Vinkius secures
ImageCharts for LlamaIndex
Every tool call from LlamaIndex to the ImageCharts MCP Server is protected by DLP redaction, cryptographic audit chains, V8 sandbox isolation, kill switch, and financial circuit breakers.
Frequently asked questions
Do I need an API key to use ImageCharts?
The API key is optional. Without it, generated charts include a watermark. With a paid API key, charts are watermark-free and you get higher rate limits. The key is passed as a query parameter to image-charts.com/chart.
What chart types can I generate?
Six types: bar charts (generate_bar_chart), pie charts (generate_pie_chart), line charts (generate_line_chart), radar charts (generate_radar_chart), bubble charts (generate_bubble_chart), and QR codes (generate_qr_code). Each supports custom colors, labels, sizes, and data series.
Can I generate QR codes from any text or URL?
Yes. The generate_qr_code tool creates a scannable QR code image from any text, URL, or data string. You can customize the size and error correction level.
How does LlamaIndex connect to MCP servers?
Use the MCP client adapter to create a connection. LlamaIndex discovers all tools and wraps them as query engine tools compatible with any LlamaIndex agent.
Can I combine MCP tools with vector stores?
Yes. LlamaIndex agents can query ImageCharts tools and vector store indexes in the same turn, combining real-time and embedded data for grounded responses.
Does LlamaIndex support async MCP calls?
Yes. LlamaIndex's async agent framework supports concurrent MCP tool calls for high-throughput data processing pipelines.
BasicMCPClient not found
Install: pip install llama-index-tools-mcp
Explore More MCP Servers
View all →
Cocktail API
8 toolsSearch cocktail recipes — audit ingredients and instructions via AI.

Portfolio CSV Analyzer
1 toolsParse massive CSV exports from brokers like DEGIRO or XTB instantly. Streams financial data locally to prevent AI crashes, returning clean column schemas and sample data.
Traefik Proxy
18 toolsMonitor and manage your Traefik Proxy infrastructure — inspect routers, services, and middlewares directly from your AI agent.

PubMed
3 toolsSearch 37M+ biomedical research articles from the world's largest medical literature database — with full abstracts, authors, MeSH terms, and citation tracking.