Bring Data Visualization
to Cline
Learn how to connect ImageCharts to Cline and start using 10 AI agent tools in minutes. Fully managed, enterprise secure, and ready to use without writing a single line of code.
Compatible with every major AI agent and IDE
 Gemini
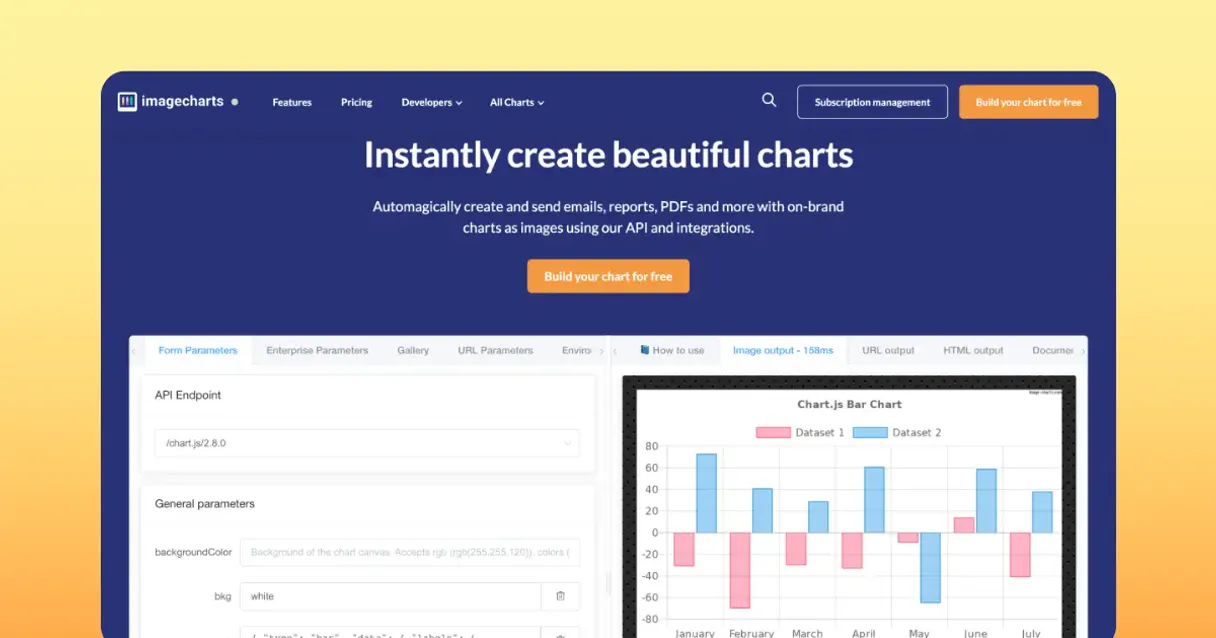
What is the ImageCharts MCP Server?
Connect ImageCharts to any AI agent and generate data visualizations through natural conversation.
What you can do
- Bar Charts — Generate vertical/horizontal bar charts with custom colors, labels, and data series
- Pie Charts — Create pie and doughnut charts with percentage labels
- Line Charts — Build trend charts with multiple data series and markers
- Radar Charts — Generate radar/spider charts for multi-dimensional comparisons
- Bubble Charts — Create scatter/bubble visualizations with size encoding
- QR Codes — Generate scannable QR codes from any text or URL
How it works
- Subscribe to this server
- Optionally enter your ImageCharts API Key for watermark-free output
- Start generating charts from Claude, Cursor, or any MCP-compatible client
Who is this for?
- Data Analysts — generate quick visualizations for reports and presentations
- Developers — embed chart images in applications, emails, or dashboards
- Marketing — create data-driven visuals for campaigns and social media
Built-in capabilities (10)
Generate a bar chart image
Generate a bubble chart image
Generate a doughnut chart image
Generate a line chart image
Generate a pie chart image
Generate a polar area chart image
Generate a QR code image
Generate a radar chart image
Generate a scatter plot image
Generate a Venn diagram image
Why Cline?
Cline operates autonomously inside VS Code. it reads your codebase, plans a strategy, and executes multi-step tasks including ImageCharts tool calls without waiting for prompts between steps. Connect 10 tools through Vinkius and Cline can fetch data, generate code, and commit changes in a single autonomous run.
- —
Cline operates autonomously. it reads your codebase, plans a strategy, and executes multi-step tasks including MCP tool calls without step-by-step prompts
- —
Runs inside VS Code, so you get MCP tool access alongside your existing extensions, terminal, and version control in a single window
- —
Cline can create, edit, and delete files based on MCP tool responses, enabling end-to-end automation from data retrieval to code generation
- —
Transparent execution: every tool call and file change is shown in Cline's activity log for full visibility and approval before committing
ImageCharts in Cline
ImageCharts and 4,000+ other MCP servers. One platform. One governance layer.
Teams that connect ImageCharts to Cline through Vinkius don't need to source, host, or maintain individual MCP servers. Every tool call runs inside a hardened runtime with credential isolation, DLP, and a signed audit chain.
Raw MCP | Vinkius | |
|---|---|---|
| Server catalog | Find and host yourself | 4,000+ managed |
| Infrastructure | Self-hosted | Sandboxed V8 isolates |
| Credential handling | Plaintext in config | Vault + runtime injection |
| Data loss prevention | None | Configurable DLP policies |
| Kill switch | None | Global instant shutdown |
| Financial circuit breakers | None | Per-server limits + alerts |
| Audit trail | None | Ed25519 signed logs |
| SIEM log streaming | None | Splunk, Datadog, Webhook |
| Honeytokens | None | Canary alerts on leak |
| Custom domains | Not applicable | DNS challenge verified |
| GDPR compliance | Manual effort | Automated purge + export |
Why teams choose Vinkius for ImageCharts in Cline
The ImageCharts MCP Server runs on Vinkius-managed infrastructure inside AWS — a purpose-built runtime with per-request V8 isolates, Ed25519 signed audit chains, and sub-40ms cold starts. All 10 tools execute in hardened sandboxes optimized for native MCP execution.
Your AI agents in Cline only access the data you authorize, with DLP that blocks sensitive information from ever reaching the model, kill switch for instant shutdown, and up to 60% token savings. Enterprise-grade infrastructure, zero maintenance.
* Every MCP server runs on Vinkius-managed infrastructure inside AWS - a purpose-built runtime with per-request V8 isolates, Ed25519 signed audit chains, and sub-40ms cold starts optimized for native MCP execution. See our infrastructure
How Vinkius secures
ImageCharts for Cline
Every tool call from Cline to the ImageCharts MCP Server is protected by DLP redaction, cryptographic audit chains, V8 sandbox isolation, kill switch, and financial circuit breakers.
Frequently asked questions
Do I need an API key to use ImageCharts?
The API key is optional. Without it, generated charts include a watermark. With a paid API key, charts are watermark-free and you get higher rate limits. The key is passed as a query parameter to image-charts.com/chart.
What chart types can I generate?
Six types: bar charts (generate_bar_chart), pie charts (generate_pie_chart), line charts (generate_line_chart), radar charts (generate_radar_chart), bubble charts (generate_bubble_chart), and QR codes (generate_qr_code). Each supports custom colors, labels, sizes, and data series.
Can I generate QR codes from any text or URL?
Yes. The generate_qr_code tool creates a scannable QR code image from any text, URL, or data string. You can customize the size and error correction level.
How does Cline connect to MCP servers?
Cline reads MCP server configurations from its settings panel in VS Code. Add the server URL and Cline discovers all available tools on initialization.
Can Cline run MCP tools without approval?
By default, Cline asks for confirmation before executing tool calls. You can configure auto-approval rules for trusted servers in the settings.
Does Cline support multiple MCP servers at once?
Yes. Configure as many servers as needed. Cline can use tools from different servers within the same autonomous task execution.
Server shows error in sidebar
Click the server name to see logs. Verify the URL and token are correct.
Explore More MCP Servers
View all →
Teamwork Projects
17 toolsManage projects, tasks, milestones, time entries, and messages via Teamwork API.

VTEX Catalog
7 toolsSearch products, manage SKUs, update stock levels, and explore categories and brands on your VTEX store — all from any AI agent.

Vertex AI Search
7 toolsSearch across your enterprise data using Google's semantic search and generative AI grounding.

Measured
8 toolsMarketing performance and incrementality analytics via Measured — track ROAS and cross-channel impact.