Bring Apm
to VS Code Copilot
Create your Vinkius account to connect Datadog Alternative to VS Code Copilot and start using all 16 AI tools in minutes. Fully managed, enterprise secure, and ready to use without writing a single line of code. No hosting, no server setup — just connect and start using.
Compatible with every major AI agent and IDE
 Gemini
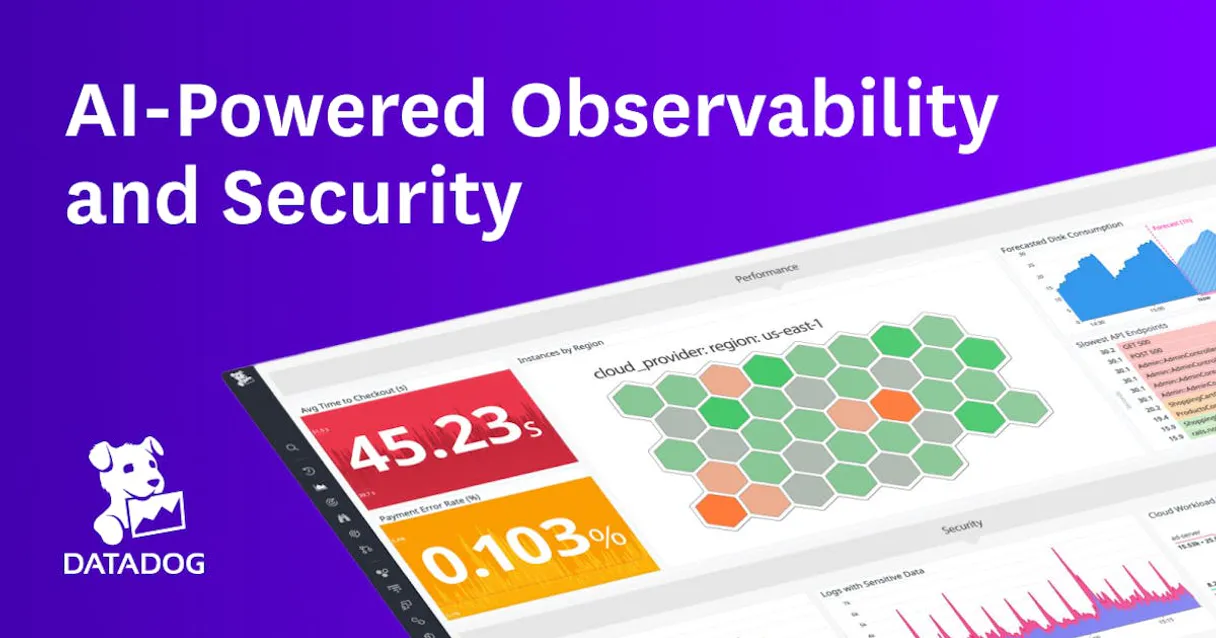
What is the Datadog Alternative MCP Server?
Connect your Datadog account to any AI agent and gain full observability over your entire infrastructure, applications and logs through natural conversation.
What you can do
- Monitor Management — List, create, update, mute and unmute alert monitors across metric, anomaly, log, service check and synthetics types
- Metrics Querying — Query raw metric timeseries data with Datadog's query syntax to analyze CPU, memory, custom business metrics and more
- Log Search — Search structured and unstructured log events using the same query syntax as the Log Explorer, filtering by service, host, status and any indexed attribute
- Dashboard Discovery — List all dashboards, view their widget configurations and audit shared access without opening the Datadog app
- Synthetics & SLOs — Audit your synthetic test coverage and Service Level Objectives to track SLA compliance across teams
- Incident Tracking — View active and recently resolved incidents with severity, responder assignments and postmortem status
- Infrastructure Inventory — List all monitored hosts with their tags, metrics summary and agent version
- Team & User Auditing — Review team membership, user roles and access permissions to maintain organizational security
How it works
- Subscribe to this server
- Enter your Datadog API Key and Application Key
- Start monitoring your stack from Claude, Cursor, or any MCP-compatible client
Stop context-switching to the Datadog dashboard every time an alert fires. Your AI acts as a dedicated SRE.
Who is this for?
- SREs & On-Call Engineers — instantly triage monitors, search error logs and check incident status without opening Datadog
- Engineering Managers — audit monitor coverage, review SLO compliance and track team ownership across services
- Developers — query metrics, inspect log events and verify synthetics directly from your IDE
Built-in capabilities (16)
Requires the monitor type (metric, anomaly, service check, event, log, process, rum, synthetics), a query string (e.g. "avg(last_5m):avg:system.cpu.user{host:myhost} > 80"), a notification message (using @user, @slack, @pagerduty) and a name. Optionally set tags, priority, renotify interval and threshold windows. Create a new Datadog monitor
Provide the dashboard ID. Get details for a specific Datadog dashboard
Provide the numeric monitor ID. Get details for a specific Datadog monitor
Use to discover available dashboards before opening a specific one. List all Datadog dashboards
Each host reports CPU, memory, disk, network metrics plus custom tags. Optionally filter by a tag string (e.g. "env:production") to narrow results. List hosts monitored by Datadog
Each incident has a title, severity, status (active, resolved), timeline, responder assignments and postmortem status. Use to audit ongoing incidents and review resolution patterns. List Datadog incident management records
Monitors track metrics, anomalies, service checks and events. Each monitor has a type (metric, anomaly, service check, event, log), name, query string, notification message and current status. Use this to audit your alerting coverage. List all Datadog monitors
Each SLO defines a target availability percentage (e.g. 99.9%) for a service over a time window (7d, 30d, 90d). Useful for auditing SLA compliance across teams. List Datadog Service Level Objectives
Each test has a type, target URL, status, locations and check frequency. Use to audit your synthetic test coverage and verify endpoints are being monitored. List Datadog Synthetics tests
Teams group users for ownership of monitors, dashboards, SLOs and incidents. Each team has a name, handle, description and user membership list. List Datadog teams
Use to audit access, identify inactive accounts and verify user permissions. List Datadog users
Useful during maintenance windows or known incidents. Provide the monitor ID. Optionally set an end timestamp for auto-unmute or a scope to mute only specific sub-alerts. Mute a Datadog monitor
The query string uses Datadog syntax like "avg:system.cpu.user{host:myhost}". Provide Unix timestamps for the from/to range. Useful for analyzing metric trends without opening a dashboard. Query Datadog metrics timeseries
Supports filtering by source, service, status, host and any indexed attribute. Example query: "service:api status:error". Returns matching log entries with full context, host info and trace ID if available. Search Datadog logs
Provide the monitor ID. Optionally set a scope to unmute only specific sub-alerts. Unmute a Datadog monitor
Provide the monitor ID and any fields to update: name, query, message, tags, priority or thresholds. Only the fields you provide will be changed. Update an existing Datadog monitor
Why VS Code Copilot?
GitHub Copilot Agent mode brings Datadog Alternative data directly into your VS Code workflow. With a project-scoped config, the entire team shares access to 16 tools. Copilot queries live data, generates typed code, and writes tests from actual API responses, all without leaving the editor.
- —
VS Code is used by over 70% of developers. adding MCP tools to Copilot means your team can leverage external data without leaving their primary editor
- —
Project-scoped MCP configs (
.vscode/mcp.json) let you commit server configurations to your repository, ensuring the entire team shares the same tool access - —
Copilot's Agent mode integrates MCP tools seamlessly with file editing, terminal commands, and workspace search in a single agentic loop
- —
GitHub's enterprise compliance and audit features extend to MCP tool usage, providing visibility into how AI interacts with external services
Datadog Alternative in VS Code Copilot
Why run Datadog Alternative with Vinkius?
The Datadog Alternative connection runs on our fully managed, secure cloud infrastructure. We handle the hosting, maintenance, and security so you don't have to deal with servers or code. All 16 tools are ready to work instantly without any complex setup.
You stay in complete control of your data. Your AI only accesses the information you approve, keeping your sensitive passwords and private details completely safe. Plus, with automatic optimizations, your AI works faster and more efficiently.
* Every connection is hosted and maintained by Vinkius. We handle the security, updates, and infrastructure so you don't have to write code or manage servers. See our infrastructure
Over 4,000 integrations ready for AI agents
Explore a vast library of pre-built integrations, optimized and ready to deploy.
Connect securely in under 30 seconds
Generate tokens to authenticate and link external services in a single step.
Complete visibility into every agent action
Audit live requests, latency, success rates, and active security compliance policies.
Optimize spending and track token ROI
Analyze real-time token consumption and cost metrics detailed by connection.


Explore our live AI Agents Analytics dashboard to see it all working
This dashboard is included when you connect Datadog Alternative using Vinkius. You will never be left in the dark about what your AI agents are doing with your tools.
Datadog Alternative and 4,000+ other AI tools. No hosting, no code, ready to use.
Professionals who connect Datadog Alternative to VS Code Copilot through Vinkius don't need to write code, manage servers, or worry about security. Everything is pre-configured, secure, and runs automatically in the background.
Raw MCP | Vinkius | |
|---|---|---|
| Ready-to-use MCPs | Find and configure each manually | 4,000+ MCPs ready to use |
| Connection Setup | Manual coding & server setup | 1-click instant connection |
| Server Hosting | You host it yourself (needs 24/7 uptime) | 100% hosted & managed by Vinkius |
| Security & Privacy | Stored in plaintext config files | Bank-grade encrypted vault |
| Activity Visibility | Blind execution (no logs or tracking) | Live dashboard with real-time logs |
| Cost Control | Runaway AI token spend risk | Automatic budget limits |
| Revoking Access | Must delete files or code to stop | 1-click disconnect button |
How Vinkius secures
Datadog Alternative for VS Code Copilot
Every request between VS Code Copilot and Datadog Alternative is protected by our secure gateway. We automatically keep your sensitive data private, prevent unauthorized access, and let you disconnect instantly at any time.
Frequently asked questions
What's the difference between Datadog API Key and Application Key?
The API Key authenticates your requests to the Datadog platform and is required for all endpoints. The Application Key is an additional layer of authorization that controls what actions your integration can perform. Both are generated in Organization Settings > API and Application Keys. Most Datadog API endpoints require both keys.
Can I mute a monitor during a maintenance window?
Yes! Use the mute_monitor action with the monitor ID. You can optionally set an end timestamp (ISO 8601) for the mute to automatically expire, or specify a scope to mute only certain sub-alerts (e.g. 'env:staging'). Use unmute_monitor to re-enable notifications.
What query syntax does the metrics endpoint use?
Datadog uses a specific query format: [function]:[metric]{[tags]}. For example: avg:system.cpu.user{host:web01} returns the average CPU user time for host web01. Common functions include avg, sum, max, min, count. Time windows are specified in the query as avg(last_5m):... or passed as from/to Unix timestamps to the tool.
Which VS Code version supports MCP?
MCP support requires VS Code 1.99 or later with the GitHub Copilot extension. Ensure both are updated to the latest version. Older versions of Copilot may not expose the Agent mode toggle.
How do I switch to Agent mode?
Open the Copilot Chat panel and look for two mode options: "Ask" and "Agent". Click "Agent" to enable autonomous tool calling. In Ask mode, Copilot provides conversational answers but cannot invoke MCP tools.
Can I restrict which MCP tools Copilot can access?
Yes. VS Code shows a tool consent dialog before any MCP tool is invoked for the first time. You can also configure tool access policies at the organization level through GitHub Copilot settings.
Does MCP work in VS Code Remote or Codespaces?
Yes. MCP servers configured via .vscode/mcp.json work in Remote SSH, WSL, and GitHub Codespaces environments. The MCP connection is established from the remote host, so ensure the server URL is accessible from that environment.
MCP tools not available
Ensure you are in Agent mode in Copilot Chat. MCP tools only appear in Agent mode.
Explore More MCP Servers
View all →
Freshdesk
10 toolsResolve customer tickets faster with omnichannel helpdesk tools, smart automation, and self-service portals your users will love.

Intruder
10 toolsAutomate vulnerability scanning and security monitoring via Intruder.io API.

Weimob / 微盟
10 toolsLeading E-commerce and marketing SaaS platform in China — manage products, orders, and members via AI.

Liveblocks (Collaborative)
19 toolsManage real-time collaborative rooms, user presence, and shared storage via Liveblocks — list rooms, track active users, and handle threads directly from your AI agent.