Bring Electricity Market
to Claude Desktop
Create your Vinkius account to connect AEMO Australian Energy to Claude Desktop and start using all 12 AI tools in minutes. Fully managed, enterprise secure, and ready to use without writing a single line of code. No hosting, no server setup — just connect and start using.
Compatible with every major AI agent and IDE
 Gemini
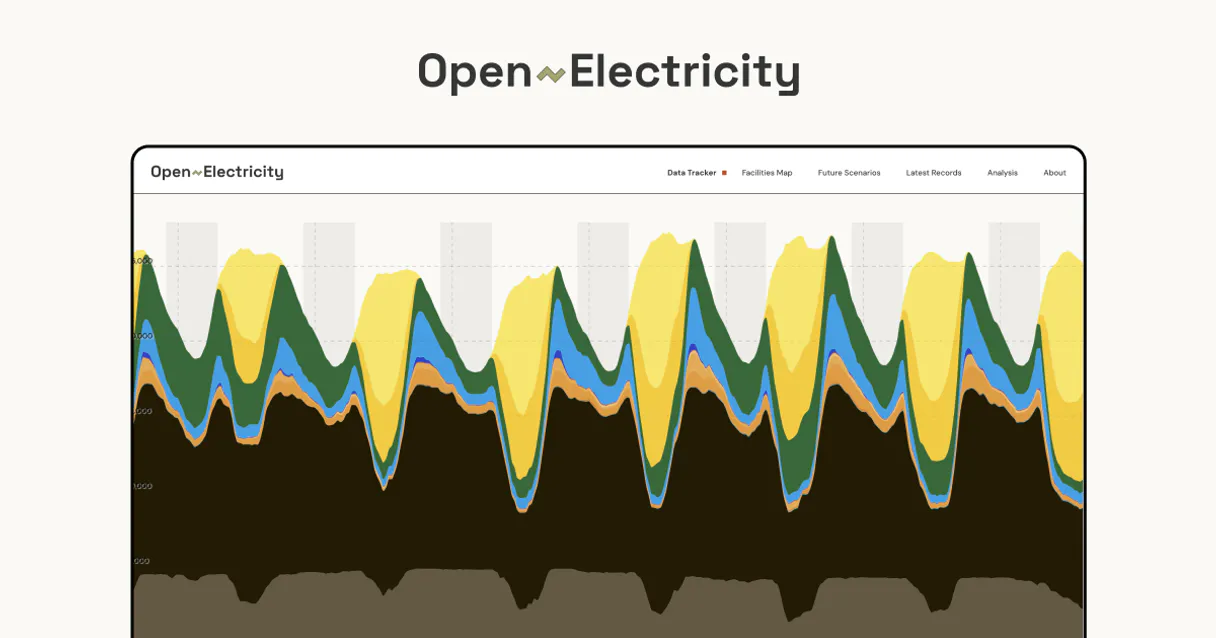
What is the AEMO Australian Energy MCP Server?
Connect to OpenElectricity API (powered by AEMO data) and bring real-time Australian energy market intelligence to any AI agent. Monitor the National Electricity Market (NEM) and Wholesale Electricity Market (WEM), track renewable energy transition, and analyze power generation across all Australian states.
What you can do
- Spot Prices — Retrieve real-time and historical wholesale electricity prices (RRP) by Australian region (NSW, VIC, QLD, SA, TAS)
- Power Generation — Access total network generation and breakdown by fuel technology (solar, wind, coal, gas, hydro, battery)
- Energy Demand — Monitor electricity demand across the NEM with 5-minute, hourly, daily, or monthly granularity
- Facility Data — Get generation output from specific power stations, solar farms, wind farms, and battery installations
- Renewable Proportion — Track what percentage of Australia's electricity comes from renewable sources in real-time
- Regional Analysis — Compare power generation and demand across Australian states and territories
- Emissions Tracking — Query pollution data including NOx, SO2, CO, PM10, PM2.5 from the National Pollutant Inventory
- Market Updates — Fetch commentary and updates about price spikes, outages, and notable market events
- Facility Registry — List all energy generation facilities with their fuel type, status, and capacity
- Available Metrics — Explore the full range of queryable metrics in the API
- User Account — Check your API plan, rate limits, and usage statistics
- Plans & Pricing — View available subscription tiers and features
How it works
- Subscribe to this server
- Enter your OpenElectricity API Bearer token (free Community plan available)
- Start querying Australian energy data from Claude, Cursor, or any MCP-compatible client
Your AI becomes an Australian energy analyst, helping you understand the grid, track the renewable transition, and make data-driven decisions.
Who is this for?
- Energy Analysts — retrieve spot prices, generation mix, and demand forecasts for market reports
- Sustainability Teams — monitor renewable energy proportions and emissions for environmental reporting
- Researchers & Academics — access granular 5-minute interval data for energy studies and modeling
- Homeowners with Solar — understand when wholesale prices are negative (solar duck curve) and optimize self-consumption
- EV Owners — find optimal charging times when prices are low and renewable proportion is high
- Policy Makers — track Australia's energy transition progress and state-by-state renewable adoption
Built-in capabilities (12)
g. "ER01" for Eraring, "BNGSF1" for Bungala Solar). Shows actual output over time. Get generation data for a specific energy facility
Supports interval and date range filtering. Get market data including spot prices and demand by region
Get market updates and social posts from OpenElectricity
Useful for understanding the energy mix and renewable vs fossil fuel split. Get network data grouped by fuel technology type
Get network data grouped by Australian region/state
Supports interval aggregation (5m, 1h, 1d, 7d, 1M, 1y) and date range filtering. Get time series network data for power, energy, demand and generation
Get available API plans and pricing tiers
5, VOC) reported to the National Pollutant Inventory by energy facilities. Filter by facility, pollutant, or category. Get pollution and emissions data from NPI (National Pollutant Inventory)
Essential for tracking Australia's energy transition progress. Get renewable energy proportion data
Get current user profile and API account details
Filter by fuel technology, status, network, or facility code. List energy facilities and generation units
List all available metrics in the OpenElectricity API
Why Claude Desktop?
Claude Desktop is the definitive way to connect AEMO Australian Energy to your AI workflow. Add Vinkius Edge URL to your config, restart the app, and Claude immediately exposes all 12 tools in the chat interface. ask a question, Claude calls the right tool, and you see the answer. Zero code, zero context switching.
- —
Claude Desktop is the reference MCP client. it was designed alongside the protocol itself, ensuring the most complete and stable MCP implementation available
- —
Zero-code configuration: add a server URL to a JSON file and Claude instantly discovers and exposes all available tools in the chat interface
- —
Claude's extended thinking capability lets it reason through multi-step tool usage, chaining multiple API calls to answer complex questions
- —
Enterprise-grade security with local config storage. your tokens never leave your machine, and connections go directly to Vinkius Edge network
AEMO Australian Energy in Claude Desktop
Why run AEMO Australian Energy with Vinkius?
The AEMO Australian Energy connection runs on our fully managed, secure cloud infrastructure. We handle the hosting, maintenance, and security so you don't have to deal with servers or code. All 12 tools are ready to work instantly without any complex setup.
You stay in complete control of your data. Your AI only accesses the information you approve, keeping your sensitive passwords and private details completely safe. Plus, with automatic optimizations, your AI works faster and more efficiently.
* Every connection is hosted and maintained by Vinkius. We handle the security, updates, and infrastructure so you don't have to write code or manage servers. See our infrastructure
Over 4,000 integrations ready for AI agents
Explore a vast library of pre-built integrations, optimized and ready to deploy.
Connect securely in under 30 seconds
Generate tokens to authenticate and link external services in a single step.
Complete visibility into every agent action
Audit live requests, latency, success rates, and active security compliance policies.
Optimize spending and track token ROI
Analyze real-time token consumption and cost metrics detailed by connection.


Explore our live AI Agents Analytics dashboard to see it all working
This dashboard is included when you connect AEMO Australian Energy using Vinkius. You will never be left in the dark about what your AI agents are doing with your tools.
AEMO Australian Energy and 4,000+ other AI tools. No hosting, no code, ready to use.
Professionals who connect AEMO Australian Energy to Claude Desktop through Vinkius don't need to write code, manage servers, or worry about security. Everything is pre-configured, secure, and runs automatically in the background.
Raw MCP | Vinkius | |
|---|---|---|
| Ready-to-use MCPs | Find and configure each manually | 4,000+ MCPs ready to use |
| Connection Setup | Manual coding & server setup | 1-click instant connection |
| Server Hosting | You host it yourself (needs 24/7 uptime) | 100% hosted & managed by Vinkius |
| Security & Privacy | Stored in plaintext config files | Bank-grade encrypted vault |
| Activity Visibility | Blind execution (no logs or tracking) | Live dashboard with real-time logs |
| Cost Control | Runaway AI token spend risk | Automatic budget limits |
| Revoking Access | Must delete files or code to stop | 1-click disconnect button |
How Vinkius secures
AEMO Australian Energy for Claude Desktop
Every request between Claude Desktop and AEMO Australian Energy is protected by our secure gateway. We automatically keep your sensitive data private, prevent unauthorized access, and let you disconnect instantly at any time.
Frequently asked questions
What Australian regions/states are covered in the NEM data?
The National Electricity Market (NEM) covers five regions: New South Wales (NSW1), Victoria (VIC1), Queensland (QLD1), South Australia (SA1), and Tasmania (TAS1). The API also supports the Wholesale Electricity Market (WEM) for Western Australia. Data is available at both the national aggregate level and broken down by individual region.
How do I get an API token for OpenElectricity?
Visit the OpenElectricity developer portal at https://openelectricity.org.au/content/developers and sign up for a free Community plan. You'll receive a Bearer token that you can paste into the credential field. The Community plan provides generous rate limits suitable for individual use and research. Higher-tier plans (Pro, Academic, Enterprise) are available for commercial applications.
Can I track the percentage of renewable energy in real-time?
Yes! Use the get_renewable_proportion tool to fetch the current percentage of electricity generation coming from renewable sources (solar, wind, hydro, battery) versus fossil fuels (coal, gas). You can query this at 5-minute intervals for live tracking, or aggregate to hourly, daily, or monthly views. The get_network_by_fueltech tool also provides a detailed breakdown showing each technology's contribution separately.
What time intervals are available for querying historical data?
The API supports multiple time granularities: 5m (5-minute intervals, most granular), 1h (hourly), 1d (daily), 7d (weekly), 1M (monthly), 3M (quarterly), 1y (yearly), season (seasonal aggregation), and fy (financial year). You can specify date ranges using date_start and date_end parameters in ISO format. Historical data extends back several years for most metrics.
How does Claude Desktop discover MCP tools?
When Claude Desktop starts, it reads the claude_desktop_config.json file and connects to each configured MCP server. It calls the tools/list endpoint to fetch the schema for every available tool, then surfaces them as clickable options in the chat interface via the 🔌 icon.
What happens if the MCP server is temporarily unavailable?
Claude Desktop handles disconnections gracefully. if the server is unreachable at startup, the tools simply won't appear. Once the server becomes available again, restarting Claude Desktop will re-establish the connection. There is no timeout penalty or error loop.
Can I connect multiple MCP servers simultaneously?
Yes. You can add as many servers as you need in the mcpServers section of the config file. Each server appears as a separate tool provider, and Claude can use tools from multiple servers in a single conversation turn.
Is there a limit on the number of tools per server?
Claude Desktop can handle hundreds of tools per server. However, for optimal LLM performance, Vinkius servers are designed to expose focused, well-documented tool sets rather than overwhelming the model with too many options.
Does Claude Desktop support Streamable HTTP transport?
Yes. Claude Desktop supports both SSE (Server-Sent Events) and the newer Streamable HTTP transport that Vinkius uses. Simply provide the server URL. Claude auto-negotiates the transport protocol.
Server not appearing after restart
Ensure the JSON is valid (no trailing commas). Check the file path: ~/Library/Application Support/Claude/claude_desktop_config.json (macOS) or %APPDATA%\\Claude\\ (Windows).
Authentication error
Verify your Vinkius token is correct. Go to cloud.vinkius.com to regenerate it if needed.
Tools not showing in chat
Click the 🔌 icon at the bottom of the chat input. If it shows 0 tools, the server may still be connecting. wait a few seconds.
Explore More MCP Servers
View all →
Beagle Security
9 toolsScan your web applications for vulnerabilities, generate penetration test reports, and strengthen your security posture proactively.

Invoiced
10 toolsManage accounts receivable, invoices, and payments via Invoiced API.
Redis Vector
6 toolsEquip your AI to autonomously manage embeddings, run KNN similarity searches, and administrate vector indexes natively inside your Redis stack.

Builder
10 toolsAutomate Builder.io headless CMS workflows — generate content blocks, update models, and orchestrate visual components directly from any AI agent.