ImageCharts MCP Server for ClineGive Cline instant access to 10 tools to Generate Bar Chart, Generate Bubble Chart, Generate Doughnut Chart, and more
Cline is an autonomous AI coding agent inside VS Code that plans, executes, and iterates on tasks. Wire ImageCharts through Vinkius and Cline gains direct access to every tool. from data retrieval to workflow automation. without leaving the terminal.
Ask AI about this MCP Server for Cline
The ImageCharts MCP Server for Cline is a standout in the Data Analytics category — giving your AI agent 10 tools to work with, ready to go from day one.
Vinkius delivers Streamable HTTP and SSE to any MCP client
 Gemini
{
  "mcpServers": {
    "imagecharts": {
      "url": "https://edge.vinkius.com/[YOUR_TOKEN_HERE]/mcp"
    }
  }
}Vinkius Desktop App
The modern way to manage MCP Servers — no config files, no terminal commands. Install ImageCharts and 4,000+ MCP Servers from a single visual interface.


* Every MCP server runs on Vinkius-managed infrastructure inside AWS - a purpose-built runtime with per-request V8 isolates, Ed25519 signed audit chains, and sub-40ms cold starts optimized for native MCP execution. See our infrastructure
About ImageCharts MCP Server
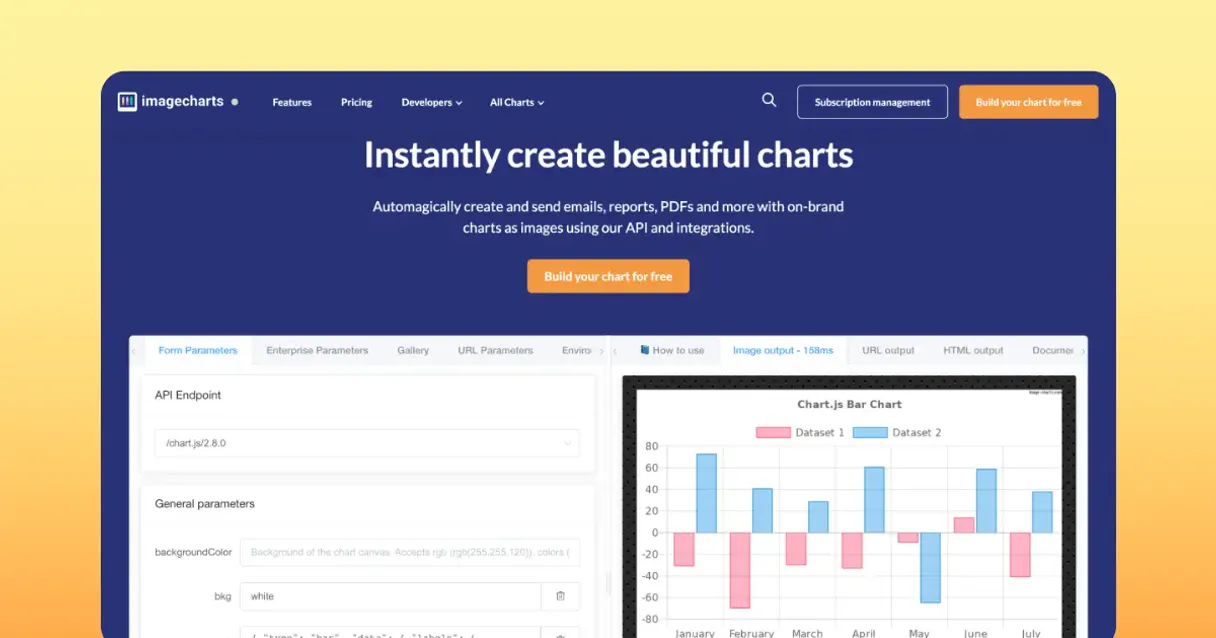
Connect ImageCharts to any AI agent and generate data visualizations through natural conversation.
Cline operates autonomously inside VS Code. it reads your codebase, plans a strategy, and executes multi-step tasks including ImageCharts tool calls without waiting for prompts between steps. Connect 10 tools through Vinkius and Cline can fetch data, generate code, and commit changes in a single autonomous run.
What you can do
- Bar Charts — Generate vertical/horizontal bar charts with custom colors, labels, and data series
- Pie Charts — Create pie and doughnut charts with percentage labels
- Line Charts — Build trend charts with multiple data series and markers
- Radar Charts — Generate radar/spider charts for multi-dimensional comparisons
- Bubble Charts — Create scatter/bubble visualizations with size encoding
- QR Codes — Generate scannable QR codes from any text or URL
The ImageCharts MCP Server exposes 10 tools through the Vinkius. Connect it to Cline in under two minutes — credentials fully managed, no infrastructure to provision, no vendor lock-in. Your configuration, your data, your control.
All 10 ImageCharts tools available for Cline
When Cline connects to ImageCharts through Vinkius, your AI agent gets direct access to every tool listed below — spanning data-visualization, chart-generation, qr-codes, and more. Every call runs in a secure, isolated environment with full audit visibility. Beyond a simple connection, you get real-time monitoring of agent activity, enterprise governance, and optimized token usage.
Generate bar chart on ImageCharts
Generate a bar chart image
Generate bubble chart on ImageCharts
Generate a bubble chart image
Generate doughnut chart on ImageCharts
Generate a doughnut chart image
Generate line chart on ImageCharts
Generate a line chart image
Generate pie chart on ImageCharts
Generate a pie chart image
Generate polar area chart on ImageCharts
Generate a polar area chart image
Generate qr code on ImageCharts
Generate a QR code image
Generate radar chart on ImageCharts
Generate a radar chart image
Generate scatter plot on ImageCharts
Generate a scatter plot image
Generate venn diagram on ImageCharts
Generate a Venn diagram image
Connect ImageCharts to Cline via MCP
Follow these steps to wire ImageCharts into Cline. The entire setup takes under two minutes — your credentials stay safe behind Vinkius.
Open Cline MCP Settings
Add remote server
Enable the server
Start using ImageCharts
Why Use Cline with the ImageCharts MCP Server
Cline provides unique advantages when paired with ImageCharts through the Model Context Protocol.
Cline operates autonomously. it reads your codebase, plans a strategy, and executes multi-step tasks including MCP tool calls without step-by-step prompts
Runs inside VS Code, so you get MCP tool access alongside your existing extensions, terminal, and version control in a single window
Cline can create, edit, and delete files based on MCP tool responses, enabling end-to-end automation from data retrieval to code generation
Transparent execution: every tool call and file change is shown in Cline's activity log for full visibility and approval before committing
ImageCharts + Cline Use Cases
Practical scenarios where Cline combined with the ImageCharts MCP Server delivers measurable value.
Autonomous feature building: tell Cline to fetch data from ImageCharts and scaffold a complete module with types, handlers, and tests
Codebase refactoring: use ImageCharts tools to validate live data while Cline restructures your code to match updated schemas
Automated testing: Cline fetches real responses from ImageCharts and generates snapshot tests or mocks based on actual payloads
Incident response: query ImageCharts for real-time status and let Cline generate hotfix patches based on the findings
Example Prompts for ImageCharts in Cline
Ready-to-use prompts you can give your Cline agent to start working with ImageCharts immediately.
"Create a bar chart showing Q1-Q4 revenue and a pie chart of market share."
"Generate a QR code for our website and a line chart of monthly user growth."
"Create a radar chart comparing 5 team skills and a bubble chart of project priorities."
Troubleshooting ImageCharts MCP Server with Cline
Common issues when connecting ImageCharts to Cline through Vinkius, and how to resolve them.
Server shows error in sidebar
ImageCharts + Cline FAQ
Common questions about integrating ImageCharts MCP Server with Cline.
How does Cline connect to MCP servers?
Can Cline run MCP tools without approval?
Does Cline support multiple MCP servers at once?
Explore More MCP Servers
View all →Ghostfolio (Investment Tracker)
9 toolsTrack your wealth and manage investment portfolios via Ghostfolio — monitor holdings, record activities, and analyze performance through AI.

Discogs
13 toolsExplore the world's largest music database — search artists, releases, labels, and marketplace listings via AI.
Strava Training
12 toolsAnalyze Strava activities, segments, streams (HR, power, GPS), zones, laps, and athlete stats.

Ember Climate
11 toolsAccess global electricity data — generation, demand, emissions, and capacity from Ember Climate's open energy API.