Bring Llm Monitoring
to Cline
Create your Vinkius account to connect New Relic AI (LLM Observability) to Cline and start using all 10 AI tools in minutes. Fully managed, enterprise secure, and ready to use without writing a single line of code. No hosting, no server setup — just connect and start using.
Compatible with every major AI agent and IDE
 Gemini
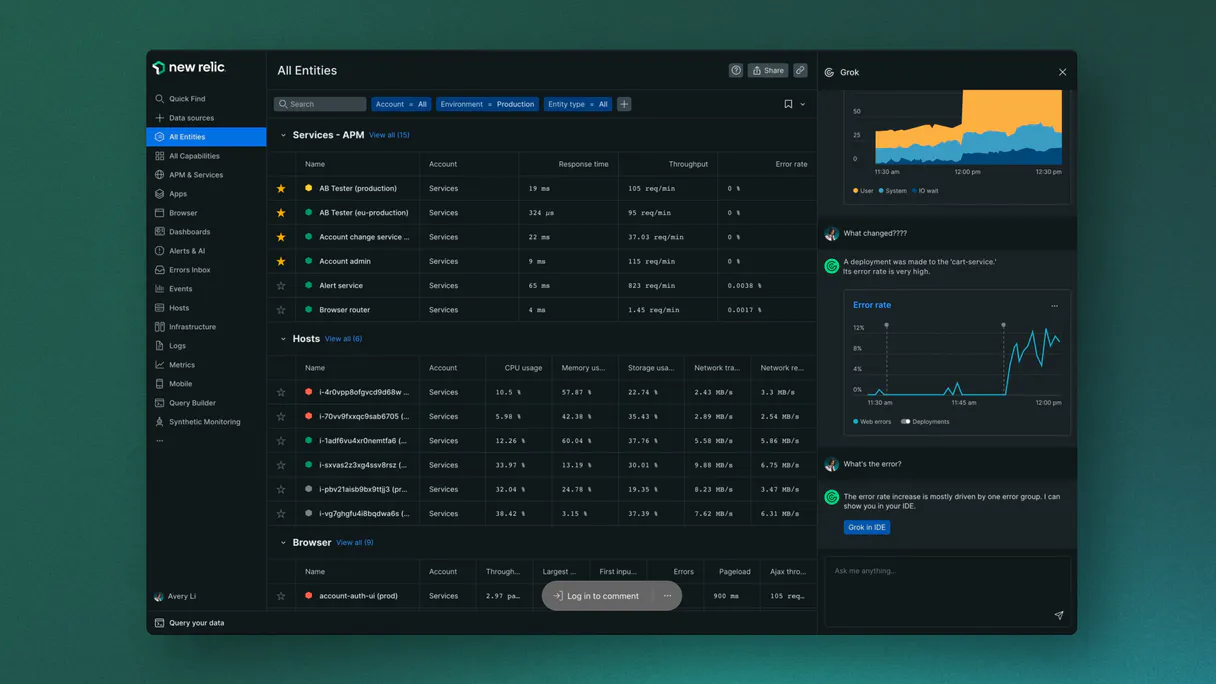
What is the New Relic AI (LLM Observability) MCP Server?
Connect your New Relic AI account to any AI agent and take full control of your LLM observability, token cost tracking, and performance analytics through natural conversation.
What you can do
- LLM Telemetry Audit — Retrieve detailed LLM chat completion messages and prompt inputs directly from your agent to understand literal model behavior in real-time
- Token Cost Tracking — Execute structural extraction of model costs to calculate exact USD token consumption across your entire AI infrastructure securely
- Performance Monitoring — Extract p95 latency matrices and average response times to ensure your LLM text generation remains performant and sub-second
- User Feedback Loop — Retrieve chronological feedback messages and 1-5 rating scores dumped by human supervisors to identify quality regressions natively
- Custom NRQL Execution — Run sophisticated read-only queries using the New Relic Query Language (NRQL) to extract rich insights from multi-tenant AI datasets instantly
- Custom Event Injection — Post atomic generic telemetry rows to track internal agent states and custom behavioral markers across your observability pipeline
- Resource Discovery — Enumerate active APM apps, dashboards, and alert policies to audit your AI environment's structural health and PagerDuty configurations
How it works
- Subscribe to this server
- Enter your New Relic API Key and Account ID
- Start monitoring your AI stack from Claude, Cursor, or any MCP-compatible client
Who is this for?
- AI Engineers — monitor LLM prompt performance and verify model accuracy through natural conversation without manual dashboard navigation
- Observability Leads — track global AI token costs and p95 latency benchmarks directly from your workspace to optimize infrastructure spend
- DevOps Teams — audit APM app health and verify alert policy triggers across multiple AI environments efficiently
Built-in capabilities (10)
Note that NRQL is read-only. Irreversibly vaporize explicit validations extracting rich Churn flags
Inspect deep internal arrays mitigating specific Plan Math
Dispatch an automated validation check routing explicit Gateway history
Identify precise active arrays spanning native Gateway auth
/events` inserting absolute generic `CustomAITelemetry` rows tracking internal agent state. Enumerate explicitly attached structured rules exporting active Billing
Perform structural extraction of properties driving active Account logic
Identify precise active arrays spanning native Hold parsing
Identify bounded CRM records inside the Headless New Relic Platform
Retrieve explicit Cloud logging tracing explicit Vault limits
Provision a highly-available JSON Payload generating hard Customer bindings
Why Cline?
Cline operates autonomously inside VS Code. it reads your codebase, plans a strategy, and executes multi-step tasks including New Relic AI (LLM Observability) tool calls without waiting for prompts between steps. Connect 10 tools through Vinkius and Cline can fetch data, generate code, and commit changes in a single autonomous run.
- —
Cline operates autonomously. it reads your codebase, plans a strategy, and executes multi-step tasks including MCP tool calls without step-by-step prompts
- —
Runs inside VS Code, so you get MCP tool access alongside your existing extensions, terminal, and version control in a single window
- —
Cline can create, edit, and delete files based on MCP tool responses, enabling end-to-end automation from data retrieval to code generation
- —
Transparent execution: every tool call and file change is shown in Cline's activity log for full visibility and approval before committing
New Relic AI (LLM Observability) in Cline
Why run New Relic AI (LLM Observability) with Vinkius?
The New Relic AI (LLM Observability) connection runs on our fully managed, secure cloud infrastructure. We handle the hosting, maintenance, and security so you don't have to deal with servers or code. All 10 tools are ready to work instantly without any complex setup.
You stay in complete control of your data. Your AI only accesses the information you approve, keeping your sensitive passwords and private details completely safe. Plus, with automatic optimizations, your AI works faster and more efficiently.
* Every connection is hosted and maintained by Vinkius. We handle the security, updates, and infrastructure so you don't have to write code or manage servers. See our infrastructure
Over 4,000 integrations ready for AI agents
Explore a vast library of pre-built integrations, optimized and ready to deploy.
Connect securely in under 30 seconds
Generate tokens to authenticate and link external services in a single step.
Complete visibility into every agent action
Audit live requests, latency, success rates, and active security compliance policies.
Optimize spending and track token ROI
Analyze real-time token consumption and cost metrics detailed by connection.


Explore our live AI Agents Analytics dashboard to see it all working
This dashboard is included when you connect New Relic AI (LLM Observability) using Vinkius. You will never be left in the dark about what your AI agents are doing with your tools.
New Relic AI (LLM Observability) and 4,000+ other AI tools. No hosting, no code, ready to use.
Professionals who connect New Relic AI (LLM Observability) to Cline through Vinkius don't need to write code, manage servers, or worry about security. Everything is pre-configured, secure, and runs automatically in the background.
Raw MCP | Vinkius | |
|---|---|---|
| Ready-to-use MCPs | Find and configure each manually | 4,000+ MCPs ready to use |
| Connection Setup | Manual coding & server setup | 1-click instant connection |
| Server Hosting | You host it yourself (needs 24/7 uptime) | 100% hosted & managed by Vinkius |
| Security & Privacy | Stored in plaintext config files | Bank-grade encrypted vault |
| Activity Visibility | Blind execution (no logs or tracking) | Live dashboard with real-time logs |
| Cost Control | Runaway AI token spend risk | Automatic budget limits |
| Revoking Access | Must delete files or code to stop | 1-click disconnect button |
How Vinkius secures
New Relic AI (LLM Observability) for Cline
Every request between Cline and New Relic AI (LLM Observability) is protected by our secure gateway. We automatically keep your sensitive data private, prevent unauthorized access, and let you disconnect instantly at any time.
Frequently asked questions
Can I check my total AI token costs through my agent?
Yes. Use the query_llm_costs tool. Your agent will execute a NRQL aggregation summing the tokenSpanCost property from your LLM events over the last 24 hours, faceted by model, to provide a clear financial breakdown.
How do I monitor the p95 latency of my LLM generations?
The query_llm_latency tool retrieves the average duration and latency matrices for your AI providers. Your agent will report the results as a timesheet or summary, helping you identify performance bottlenecks instantly.
Can my agent run custom NRQL queries against my telemetry data?
Absolutely. Use the custom_nrql tool to provide any valid read-only NRQL string. Your agent will query New Relic's NerdGraph API and return the resulting dataset, allowing for complete flexibility in how you analyze your AI operations.
How does Cline connect to MCP servers?
Cline reads MCP server configurations from its settings panel in VS Code. Add the server URL and Cline discovers all available tools on initialization.
Can Cline run MCP tools without approval?
By default, Cline asks for confirmation before executing tool calls. You can configure auto-approval rules for trusted servers in the settings.
Does Cline support multiple MCP servers at once?
Yes. Configure as many servers as needed. Cline can use tools from different servers within the same autonomous task execution.
Server shows error in sidebar
Click the server name to see logs. Verify the URL and token are correct.
Explore More MCP Servers
View all →
QWeather / 和风天气
10 toolsLeading professional weather data service in China — retrieve forecasts, air quality, and life indices via AI.
LearnWorlds
8 toolsBuild and sell online courses with a white-label LMS that includes interactive video, community forums, and built-in marketing tools.

Groq
8 toolsEmpower LLM applications via Groq — perform ultra-fast LPU-accelerated chat completions, handle audio transcription and translation, and use JSON mode directly from any AI agent.
CrowdStrike Falcon
8 toolsDetect threats, manage endpoints, investigate incidents, and query telemetry from CrowdStrike Falcon — the #1 endpoint detection and response platform.