Bring Infrastructure Monitoring
to Cursor
Create your Vinkius account to connect Datadog to Cursor and start using all 11 AI tools in minutes. Fully managed, enterprise secure, and ready to use without writing a single line of code. No hosting, no server setup — just connect and start using.
Compatible with every major AI agent and IDE
 Gemini
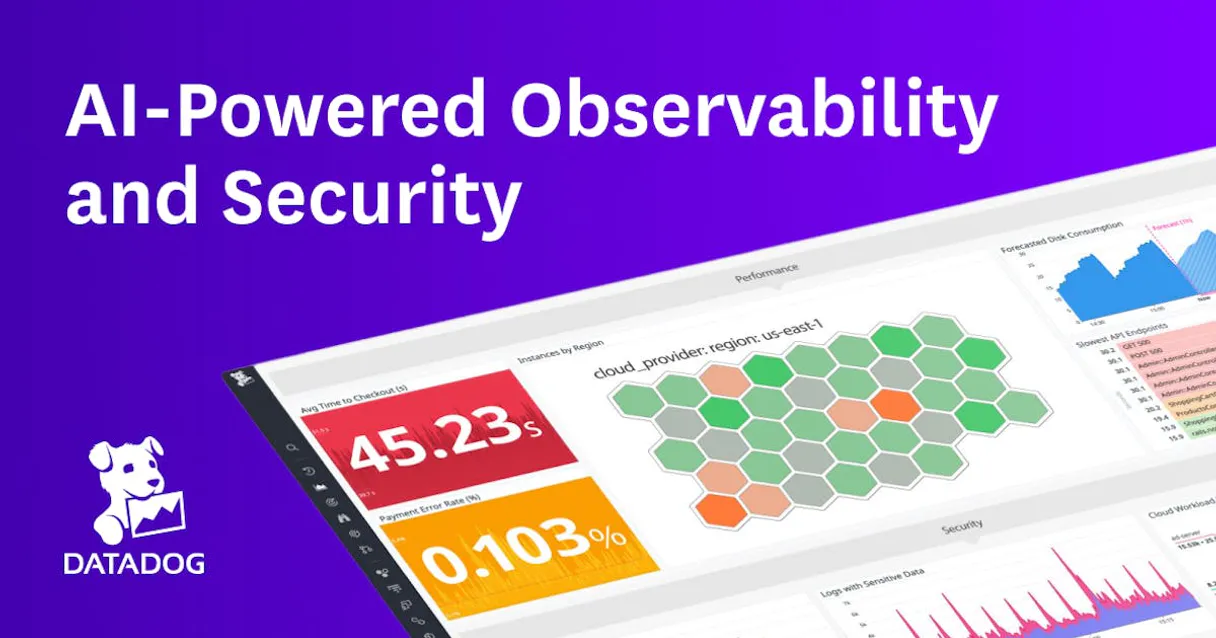
What is the Datadog MCP Server?
Connect your Datadog account to any AI agent and take full control of your infrastructure monitoring and log management through natural conversation.
What you can do
- Metric Auditing — Execute static queries targeting numeric telemetry datastores to resolve specific DDQL metrics objects generated dynamically
- Log Investigation — Perform structural extraction matching target string traces inside Datadog logs to evaluate status boundaries across your apps
- Monitor Management — Discover explicit system rule endpoints bounding configured triggers against alert metrics to verify health states
- Telemetry Extraction — Fetch timestamp arrays natively from numeric logged endpoints to analyze performance trends over specific time intervals
- Log Filtering — Apply ISO boundary mappings to compare logging payloads and identify exactly when errors or bottlenecks occurred
How it works
- Connect the Datadog integration to your AI assistant.
- Authorize using your Datadog API Key, APP Key, and Site.
- Monitor your entire cloud infrastructure using natural language.
Who is this for?
- DevOps Engineers — monitor system health and audit alerts without switching to the Datadog dashboard
- Software Developers — search through application logs and verify metric telemetry directly from the IDE or chat
- SREs — monitor active alerts and analyze performance trends during incident response
- System Admins — audit monitor configurations and verify system boundaries through natural language
Built-in capabilities (11)
Resolves all widget configurations, template variables, and layout structures for visualization rendering. Get dashboard details
Resolves notification settings, threshold values, and historical status changes for the given monitor ID. Get monitor details
Returns a list of dashboard identifiers, titles, layout types (timeboard/screenboard), and direct access URLs. List all dashboards
Returns scope tags, recurring schedules, and current status to identify planned maintenance periods. List scheduled downtimes
Returns a collection of events including titles, priority levels, and source identifiers (e.g., monitor alerts, deployment events). List events
Returns host metadata including agent version, active tags, and associated cloud provider attributes. List infrastructure hosts
Filters results by operational state (alert, warn, no data, ok) and returns monitor metadata including type, query, and current status. List monitors by state
Returns SLO definitions including target percentages, time windows, and current compliance status for monitor-based or metric-based objectives. List Service Level Objectives
Interacts with the alerting boundary to set temporary silence periods, optionally with an automatic expiration timestamp. Mute a monitor
Resolves time-series data within the specified UNIX timestamp range. Returns metric points, scope tags, and unit metadata for infrastructure and application monitoring. Query time-series metrics
Interacts with the log storage boundary to retrieve entries matching the query syntax, including timestamps, status levels, and structured attributes. Search application logs
Why Cursor?
Cursor's Agent mode turns Datadog into an in-editor superpower. Ask Cursor to generate code using live data from Datadog and it fetches, processes, and writes. all in a single agentic loop. 11 tools appear alongside file editing and terminal access, creating a unified development environment grounded in real-time information.
- —
Agent mode turns Cursor into an autonomous coding assistant that can read files, run commands, and call MCP tools without switching context
- —
Cursor's Composer feature can generate entire files using real-time data fetched through MCP. no copy-pasting from external dashboards
- —
MCP tools appear alongside built-in tools like file reading and terminal access, creating a unified agentic environment
- —
VS Code extension compatibility means your existing workflow, keybindings, and extensions all work alongside MCP tools
Datadog in Cursor
Why run Datadog with Vinkius?
The Datadog connection runs on our fully managed, secure cloud infrastructure. We handle the hosting, maintenance, and security so you don't have to deal with servers or code. All 11 tools are ready to work instantly without any complex setup.
You stay in complete control of your data. Your AI only accesses the information you approve, keeping your sensitive passwords and private details completely safe. Plus, with automatic optimizations, your AI works faster and more efficiently.
* Every connection is hosted and maintained by Vinkius. We handle the security, updates, and infrastructure so you don't have to write code or manage servers. See our infrastructure
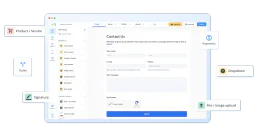
Over 4,000 integrations ready for AI agents
Explore a vast library of pre-built integrations, optimized and ready to deploy.
Connect securely in under 30 seconds
Generate tokens to authenticate and link external services in a single step.
Complete visibility into every agent action
Audit live requests, latency, success rates, and active security compliance policies.
Optimize spending and track token ROI
Analyze real-time token consumption and cost metrics detailed by connection.


Explore our live AI Agents Analytics dashboard to see it all working
This dashboard is included when you connect Datadog using Vinkius. You will never be left in the dark about what your AI agents are doing with your tools.
Datadog and 4,000+ other AI tools. No hosting, no code, ready to use.
Professionals who connect Datadog to Cursor through Vinkius don't need to write code, manage servers, or worry about security. Everything is pre-configured, secure, and runs automatically in the background.
Raw MCP | Vinkius | |
|---|---|---|
| Ready-to-use MCPs | Find and configure each manually | 4,000+ MCPs ready to use |
| Connection Setup | Manual coding & server setup | 1-click instant connection |
| Server Hosting | You host it yourself (needs 24/7 uptime) | 100% hosted & managed by Vinkius |
| Security & Privacy | Stored in plaintext config files | Bank-grade encrypted vault |
| Activity Visibility | Blind execution (no logs or tracking) | Live dashboard with real-time logs |
| Cost Control | Runaway AI token spend risk | Automatic budget limits |
| Revoking Access | Must delete files or code to stop | 1-click disconnect button |
How Vinkius secures
Datadog for Cursor
Every request between Cursor and Datadog is protected by our secure gateway. We automatically keep your sensitive data private, prevent unauthorized access, and let you disconnect instantly at any time.
Frequently asked questions
Can my agent query specific Datadog metrics using DDQL?
Yes. Use the 'query_metrics' tool. Provide your DDQL query string and the target time range. The agent will fetch the numeric timeseries data directly from Datadog's telemetry datastores.
How do I search for a specific error message across my application logs?
Use the 'search_logs' tool. Provide a query matching your error string and an ISO time boundary. The agent will retrieve the structural extraction of logs matching those parameters to help you identify failures.
Can I see which monitors are currently in an alert state?
Absolutely. The 'list_monitors' tool allows you to filter by group state (e.g., 'alert,warn'). The agent pulls the explicitly configured system triggers to show you which services are currently unhealthy.
What is Agent mode and why does it matter for MCP?
Agent mode is Cursor's autonomous execution mode where the AI can perform multi-step tasks: reading files, editing code, running terminal commands, and calling MCP tools. Without Agent mode, Cursor operates in a simpler ask-and-answer mode that doesn't support tool calling. Always ensure you're in Agent mode when working with MCP servers.
Where does Cursor store MCP configuration?
Cursor looks for MCP server configurations in a mcp.json file. You can configure servers at the project level (.cursor/mcp.json in your project root) or globally (~/.cursor/mcp.json). Project-level configs take precedence.
Can Cursor use MCP tools in inline edits?
No. MCP tools are only available in Agent mode through the chat panel. Inline completions and Tab suggestions do not trigger MCP tool calls. This is by design. tool calls require user visibility and approval.
How do I verify MCP tools are loaded?
Open Settings → Features → MCP and look for your server name. A green indicator means the server is connected. You can also check Agent mode's available tools by clicking the tools dropdown in the chat panel.
Tools not appearing in Cursor
Ensure you are in Agent mode (not Ask mode). MCP tools only work in Agent mode.
Server shows as disconnected
Check Settings → Features → MCP and verify the server status. Try clicking the refresh button.
Explore More MCP Servers
View all →
Algolia Analytics
10 toolsSearch performance intelligence — audit CTR, conversions, and top searches via AI.
123FormBuilder
12 toolsBuild and manage online forms, collect submissions, and organize workspaces with AI-powered form automation for any workflow.

MonkeyLearn
10 toolsAnalyze and extract data from text via MonkeyLearn — sentiment analysis and keyword extraction directly from your AI agent.

Podium
12 toolsWin more local customers with review generation, webchat, text marketing, and payment collection from one inbox.