Bring Dashboards
to Cursor
Create your Vinkius account to connect Grafana to Cursor and start using all 4 AI tools in minutes. Fully managed, enterprise secure, and ready to use without writing a single line of code. No hosting, no server setup — just connect and start using.
Compatible with every major AI agent and IDE
 Gemini
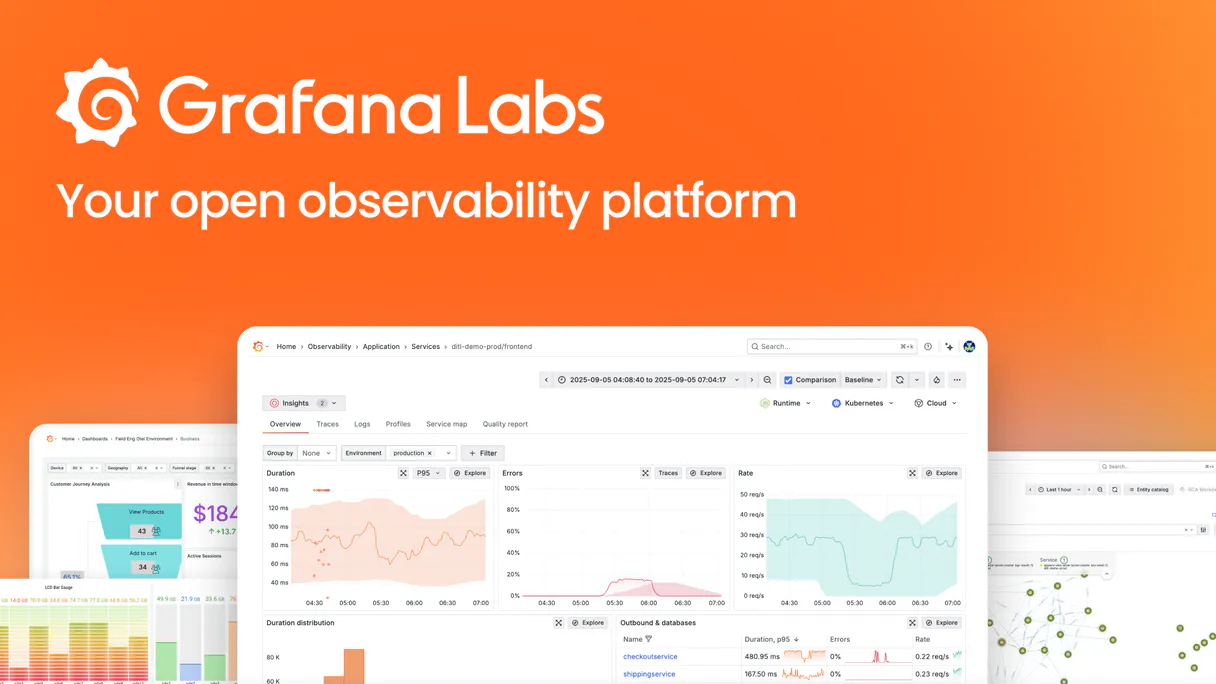
What is the Grafana MCP Server?
Connect your Grafana instance to any AI agent and take full control of your application observability, dashboard inspections, and alerting workflows through natural conversation.
What you can do
- Dashboard Discovery Orchestration — Search for Grafana dashboards by title or tag to retrieve unique UIDs and metadata natively within your chat
- Panel & Query Inspection — Retrieve the full configuration of any dashboard by UID, extracting precise PromQL, LogQL, or SQL queries and panel layouts flawlessly
- Data Source Auditing — List all configured data sources including Prometheus, Loki, CloudWatch, and SQL databases to verify connectivity boundaries securely
- Alert Monitoring Oversight — Enumerate active alert rules and retrieve current firing states to monitor system health and resolve incidents synchronously
- Observability Navigation — Analyze specific localized variables decoding active monitoring routes and extracting structural constraints from your Grafana environment
- SRE Command Center — Verify dashboard UIDs and retrieve query strings to debug performance regressions or analyze log patterns using natural language
How it works
- Subscribe to this server
- Enter your Grafana Instance URL and Service Account Token (found in Administration > Users & Access > Service accounts)
- Start inspecting your observability stack from Claude, Cursor, or any MCP-compatible client
Who is this for?
- SRE & DevOps Engineers — monitor alert rules and inspect dashboard queries without manual navigation in the Grafana UI
- Cloud Architects — audit data source configurations and verify dashboard organization using natural language
- Software Developers — extract PromQL or LogQL queries from existing panels to verify metrics and logs during development
- Incident Responders — quickly find relevant dashboards and check alert statuses during active troubleshooting
Built-in capabilities (4)
Returns alerting rules that are currently in "firing" state, including their labels and annotations. Get currently firing alerts from Grafana Unified Alerting
Requires the dashboard UID, which you can get from search_dashboards. Get full dashboard configuration including panels and queries
) are available in this Grafana instance. List all configured data sources in Grafana
Returns basic info including the UID. To inspect the panels and queries of a dashboard, use get_dashboard with the uid. Search Grafana dashboards by title or tag
Why Cursor?
Cursor's Agent mode turns Grafana into an in-editor superpower. Ask Cursor to generate code using live data from Grafana and it fetches, processes, and writes. all in a single agentic loop. 4 tools appear alongside file editing and terminal access, creating a unified development environment grounded in real-time information.
- —
Agent mode turns Cursor into an autonomous coding assistant that can read files, run commands, and call MCP tools without switching context
- —
Cursor's Composer feature can generate entire files using real-time data fetched through MCP. no copy-pasting from external dashboards
- —
MCP tools appear alongside built-in tools like file reading and terminal access, creating a unified agentic environment
- —
VS Code extension compatibility means your existing workflow, keybindings, and extensions all work alongside MCP tools
Grafana in Cursor
Why run Grafana with Vinkius?
The Grafana connection runs on our fully managed, secure cloud infrastructure. We handle the hosting, maintenance, and security so you don't have to deal with servers or code. All 4 tools are ready to work instantly without any complex setup.
You stay in complete control of your data. Your AI only accesses the information you approve, keeping your sensitive passwords and private details completely safe. Plus, with automatic optimizations, your AI works faster and more efficiently.
* Every connection is hosted and maintained by Vinkius. We handle the security, updates, and infrastructure so you don't have to write code or manage servers. See our infrastructure
Over 4,000 integrations ready for AI agents
Explore a vast library of pre-built integrations, optimized and ready to deploy.
Connect securely in under 30 seconds
Generate tokens to authenticate and link external services in a single step.
Complete visibility into every agent action
Audit live requests, latency, success rates, and active security compliance policies.
Optimize spending and track token ROI
Analyze real-time token consumption and cost metrics detailed by connection.


Explore our live AI Agents Analytics dashboard to see it all working
This dashboard is included when you connect Grafana using Vinkius. You will never be left in the dark about what your AI agents are doing with your tools.
Grafana and 4,000+ other AI tools. No hosting, no code, ready to use.
Professionals who connect Grafana to Cursor through Vinkius don't need to write code, manage servers, or worry about security. Everything is pre-configured, secure, and runs automatically in the background.
Raw MCP | Vinkius | |
|---|---|---|
| Ready-to-use MCPs | Find and configure each manually | 4,000+ MCPs ready to use |
| Connection Setup | Manual coding & server setup | 1-click instant connection |
| Server Hosting | You host it yourself (needs 24/7 uptime) | 100% hosted & managed by Vinkius |
| Security & Privacy | Stored in plaintext config files | Bank-grade encrypted vault |
| Activity Visibility | Blind execution (no logs or tracking) | Live dashboard with real-time logs |
| Cost Control | Runaway AI token spend risk | Automatic budget limits |
| Revoking Access | Must delete files or code to stop | 1-click disconnect button |
How Vinkius secures
Grafana for Cursor
Every request between Cursor and Grafana is protected by our secure gateway. We automatically keep your sensitive data private, prevent unauthorized access, and let you disconnect instantly at any time.
Frequently asked questions
Can my agent search for specific dashboards in my Grafana instance?
Yes. Use the 'search_dashboards' tool. You can provide an optional query string to match titles or tags. The agent will return basic info including the unique UID required for deeper inspection.
How do I extract the PromQL or SQL queries from a dashboard panel via chat?
Use the 'get_dashboard' tool with the dashboard UID. Your agent will retrieve the full JSON configuration, including all panels and their underlying data queries, enabling you to review the exact metrics logic natively.
Can I see firing alerts through the agent?
Absolutely. Use the 'list_alerts' tool. The agent retrieves all configured alert rules and their current statuses, allowing you to identify which monitors are currently in a firing state synchronousy.
What is Agent mode and why does it matter for MCP?
Agent mode is Cursor's autonomous execution mode where the AI can perform multi-step tasks: reading files, editing code, running terminal commands, and calling MCP tools. Without Agent mode, Cursor operates in a simpler ask-and-answer mode that doesn't support tool calling. Always ensure you're in Agent mode when working with MCP servers.
Where does Cursor store MCP configuration?
Cursor looks for MCP server configurations in a mcp.json file. You can configure servers at the project level (.cursor/mcp.json in your project root) or globally (~/.cursor/mcp.json). Project-level configs take precedence.
Can Cursor use MCP tools in inline edits?
No. MCP tools are only available in Agent mode through the chat panel. Inline completions and Tab suggestions do not trigger MCP tool calls. This is by design. tool calls require user visibility and approval.
How do I verify MCP tools are loaded?
Open Settings → Features → MCP and look for your server name. A green indicator means the server is connected. You can also check Agent mode's available tools by clicking the tools dropdown in the chat panel.
Tools not appearing in Cursor
Ensure you are in Agent mode (not Ask mode). MCP tools only work in Agent mode.
Server shows as disconnected
Check Settings → Features → MCP and verify the server status. Try clicking the refresh button.
Explore More MCP Servers
View all →
Listen Notes
7 toolsSearch and retrieve podcast and episode metadata via the Listen Notes Podcast API.
Baserow
10 toolsManage no-code databases via Baserow — list tables, query rows, create records and manage schemas from any AI agent.

Storm Glass Marine & Weather
3 toolsUniversal marine and weather intelligence — get global wave, tide, and bio data via AI.
Honeybadger (Error Tracking)
10 toolsMonitor app exceptions and uptime via Honeybadger — list projects, resolve faults, and track deployments.