Bring Energy Consumption
to VS Code Copilot
Create your Vinkius account to connect PG&E Public Datasets to VS Code Copilot and start using all 8 AI tools in minutes. Fully managed, enterprise secure, and ready to use without writing a single line of code. No hosting, no server setup — just connect and start using.
Compatible with every major AI agent and IDE
 Gemini
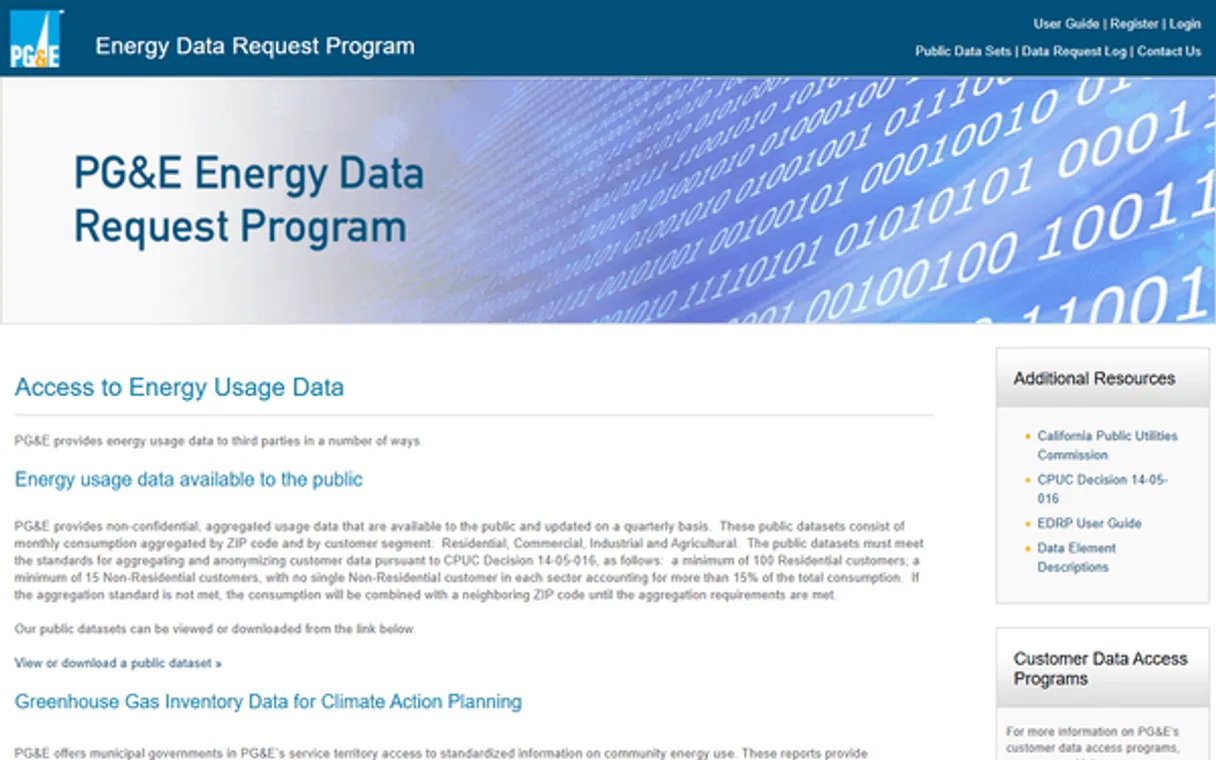
What is the PG&E Public Datasets MCP Server?
Access PG&E Public Datasets directly from any AI agent and explore energy consumption, billing trends, efficiency savings, and regional comparisons without any authentication.
What you can do
- Monthly Usage — Get monthly electricity and gas consumption by ZIP code and customer segment
- Customer Segments — View energy usage breakdown across Residential, Commercial, Industrial, and Agricultural sectors
- Yearly Trends — Analyze year-over-year energy consumption trends
- Electricity by ZIP — Access ZIP code-level electricity consumption data
- Gas by ZIP — Access ZIP code-level natural gas consumption data
- Billing Data — Retrieve average bills and cost metrics by region
- Savings Data — Analyze energy efficiency program savings and cost-effectiveness
- Regional Comparisons — Compare energy usage across multiple ZIP codes side-by-side
How it works
- Subscribe to this server
- No API key needed — completely free and public
- Start exploring PG&E energy data from Claude, Cursor, or any MCP-compatible client
Who is this for?
- Energy Researchers — analyze consumption trends and efficiency program effectiveness
- Policy Makers — understand energy affordability and regional consumption disparities
- Clean Energy Companies — identify high-consumption areas for solar/EV product targeting
- Journalists — access public energy data for reporting and analysis
Built-in capabilities (8)
Returns side-by-side usage figures (kWh and therms), customer counts, and average bills for each region. Use this to identify regional differences in energy consumption, support geographic targeting for efficiency programs, or compare urban vs. rural usage patterns. ZIP codes are comma-separated (e.g., "94102,94103,94104"). Optional dataType and year filters. Compare energy usage data between multiple ZIP codes/regions
Data is available by ZIP code and customer segment. Use this to analyze energy affordability, compare costs across regions, or identify rate impact on customers. Optional zipCode and year filters. Get billing data and average costs from PG&E public datasets
Returns monthly or annual usage figures broken down by geographic area. Use this to compare electricity usage across neighborhoods, identify high-consumption areas, or support energy efficiency targeting. Optional year filter. Get electricity consumption data for specific ZIP codes in PG&E service area
Returns monthly or annual gas usage figures by geographic area. Use this to analyze heating demand patterns, compare gas usage across regions, or identify electrification opportunities. Optional year filter. Get natural gas consumption data for specific ZIP codes in PG&E service area
Data is organized by ZIP code, month, year, and customer segment (Residential, Commercial, Industrial, Agricultural). Returns kWh for electric and therms for gas. Use this to analyze consumption patterns over time. Optional filters: dataType ("electric" or "gas"), customerType, zipCode (5-digit), and year (YYYY). Get monthly energy consumption data by ZIP code and customer segment from PG&E public datasets
Includes program participation counts, kWh/therms saved, program costs, and cost-effectiveness metrics by program type. Use this to evaluate program ROI, compare effectiveness across initiatives, or identify high-impact efficiency strategies. Optional programType and year filters. Get energy efficiency program savings data from PG&E
Shows total consumption for Residential, Commercial, Industrial, and Agricultural sectors. Use this to understand the energy consumption distribution across different customer categories. Optional dataType ("electric"/"gas") and year filters. Get energy usage broken down by customer segment (residential, commercial, industrial, agricultural)
Shows how electricity and gas usage has changed over multiple years. Use this to identify long-term patterns, growth/decline in energy demand, and seasonal variations. Optional dataType filter ("electric" or "gas"). Get yearly energy consumption trends from PG&E public data
Why VS Code Copilot?
GitHub Copilot Agent mode brings PG&E Public Datasets data directly into your VS Code workflow. With a project-scoped config, the entire team shares access to 8 tools. Copilot queries live data, generates typed code, and writes tests from actual API responses, all without leaving the editor.
- —
VS Code is used by over 70% of developers. adding MCP tools to Copilot means your team can leverage external data without leaving their primary editor
- —
Project-scoped MCP configs (
.vscode/mcp.json) let you commit server configurations to your repository, ensuring the entire team shares the same tool access - —
Copilot's Agent mode integrates MCP tools seamlessly with file editing, terminal commands, and workspace search in a single agentic loop
- —
GitHub's enterprise compliance and audit features extend to MCP tool usage, providing visibility into how AI interacts with external services
PG&E Public Datasets in VS Code Copilot
Why run PG&E Public Datasets with Vinkius?
The PG&E Public Datasets connection runs on our fully managed, secure cloud infrastructure. We handle the hosting, maintenance, and security so you don't have to deal with servers or code. All 8 tools are ready to work instantly without any complex setup.
You stay in complete control of your data. Your AI only accesses the information you approve, keeping your sensitive passwords and private details completely safe. Plus, with automatic optimizations, your AI works faster and more efficiently.
* Every connection is hosted and maintained by Vinkius. We handle the security, updates, and infrastructure so you don't have to write code or manage servers. See our infrastructure
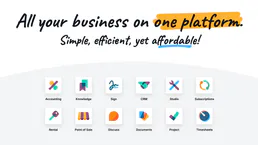
Over 4,000 integrations ready for AI agents
Explore a vast library of pre-built integrations, optimized and ready to deploy.
Connect securely in under 30 seconds
Generate tokens to authenticate and link external services in a single step.
Complete visibility into every agent action
Audit live requests, latency, success rates, and active security compliance policies.
Optimize spending and track token ROI
Analyze real-time token consumption and cost metrics detailed by connection.


Explore our live AI Agents Analytics dashboard to see it all working
This dashboard is included when you connect PG&E Public Datasets using Vinkius. You will never be left in the dark about what your AI agents are doing with your tools.
PG&E Public Datasets and 4,000+ other AI tools. No hosting, no code, ready to use.
Professionals who connect PG&E Public Datasets to VS Code Copilot through Vinkius don't need to write code, manage servers, or worry about security. Everything is pre-configured, secure, and runs automatically in the background.
Raw MCP | Vinkius | |
|---|---|---|
| Ready-to-use MCPs | Find and configure each manually | 4,000+ MCPs ready to use |
| Connection Setup | Manual coding & server setup | 1-click instant connection |
| Server Hosting | You host it yourself (needs 24/7 uptime) | 100% hosted & managed by Vinkius |
| Security & Privacy | Stored in plaintext config files | Bank-grade encrypted vault |
| Activity Visibility | Blind execution (no logs or tracking) | Live dashboard with real-time logs |
| Cost Control | Runaway AI token spend risk | Automatic budget limits |
| Revoking Access | Must delete files or code to stop | 1-click disconnect button |
How Vinkius secures
PG&E Public Datasets for VS Code Copilot
Every request between VS Code Copilot and PG&E Public Datasets is protected by our secure gateway. We automatically keep your sensitive data private, prevent unauthorized access, and let you disconnect instantly at any time.
Frequently asked questions
Is any authentication required?
No! All PG&E Public Datasets are completely free and accessible without any API key or authentication. Just subscribe and start querying energy data immediately.
What customer segments are available?
PG&E provides data for four customer segments: Residential (homes), Commercial (businesses), Industrial (manufacturing), and Agricultural (farming). Each segment has different consumption patterns and billing structures.
Can I compare multiple ZIP codes?
Yes! Use the compare_regions tool with comma-separated ZIP codes (e.g., "94102,94103,94104"). It returns side-by-side usage data, customer counts, and average bills for each region, making it easy to identify geographic differences in energy consumption.
Which VS Code version supports MCP?
MCP support requires VS Code 1.99 or later with the GitHub Copilot extension. Ensure both are updated to the latest version. Older versions of Copilot may not expose the Agent mode toggle.
How do I switch to Agent mode?
Open the Copilot Chat panel and look for two mode options: "Ask" and "Agent". Click "Agent" to enable autonomous tool calling. In Ask mode, Copilot provides conversational answers but cannot invoke MCP tools.
Can I restrict which MCP tools Copilot can access?
Yes. VS Code shows a tool consent dialog before any MCP tool is invoked for the first time. You can also configure tool access policies at the organization level through GitHub Copilot settings.
Does MCP work in VS Code Remote or Codespaces?
Yes. MCP servers configured via .vscode/mcp.json work in Remote SSH, WSL, and GitHub Codespaces environments. The MCP connection is established from the remote host, so ensure the server URL is accessible from that environment.
MCP tools not available
Ensure you are in Agent mode in Copilot Chat. MCP tools only appear in Agent mode.
Explore More MCP Servers
View all →
National Archives Catalog
40 toolsSearch and explore millions of historical documents, photos, and records from the US National Archives (NARA) directly from your AI agent.

Postmark Alternative
9 toolsAutomate transactional email via Postmark — send emails, retrieve templates, inspect bounces, and manage your delivery analytics directly from any AI agent.
Odoo Accounting
7 toolsList invoices, bills, payments, journal entries, and chart of accounts — Odoo Accounting through natural conversation.
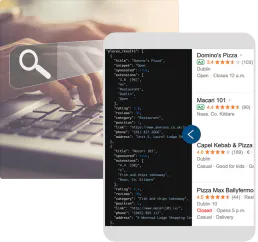
ValueSERP
10 toolsBring real-time Google Search data into your AI agent. Search organically, find images, news, scholars, and related questions without getting blocked.