


Monitoring Observability
The best Monitoring Observability connectors for your AI agents.

CrowdStrike Falcon
8 toolsDetect threats, manage endpoints, investigate incidents, and query telemetry from CrowdStrike Falcon — the #1 endpoint detection and response platform.

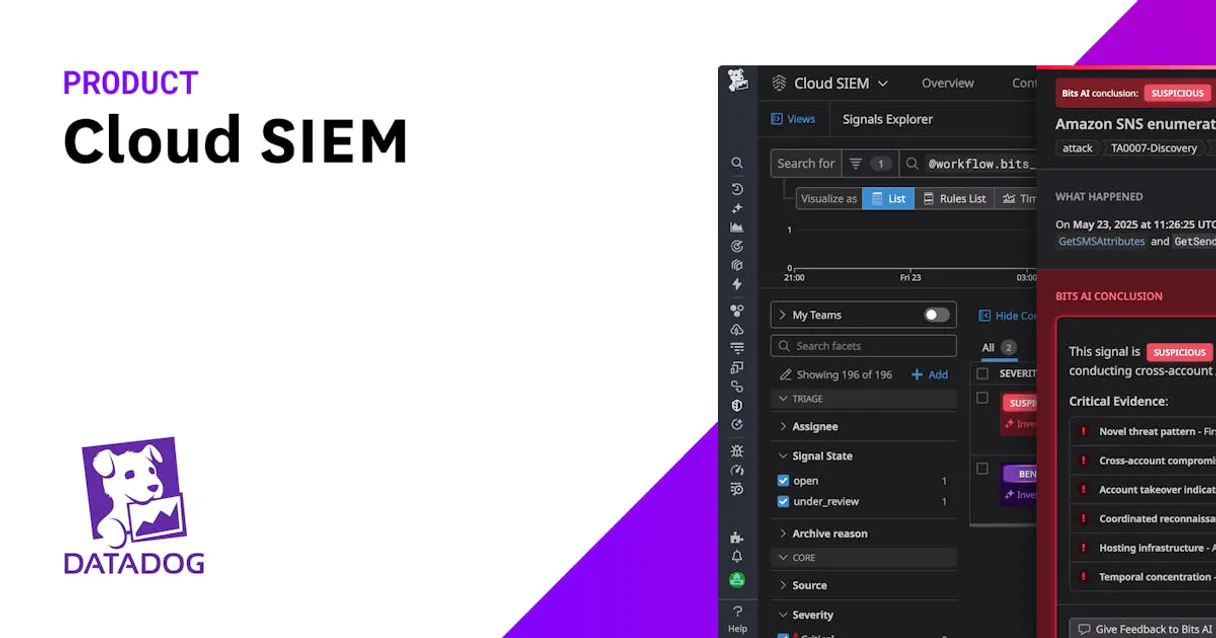
Datadog Cloud SIEM
10 toolsManage cloud security via Datadog — search security signals, triage alerts, and audit detection rules directly from any AI agent.

X Ads (Twitter)
8 toolsManage your X Ads campaigns — audit accounts, line items, and analytics via AI.

Airbnb
12 toolsSearch and manage Airbnb listings, experiences, reservations, and pricing directly from any AI agent.

Amazon S3
10 toolsCloud object storage orchestration — manage buckets, objects, and metadata via AI.

Atlassian (Jira & Confluence)
9 toolsThe ultimate AI bridge for Jira and Confluence — manage projects, agile boards, and wikis via AI.

Google BigQuery
7 toolsEmpower your AI agent to query massive datasets via BigQuery — execute Standard SQL, track active jobs, and inspect table schemas natively.

Box
7 toolsManage files, folders, collaborations, and metadata on Box — the enterprise cloud content management platform.

Confluence
8 toolsEmpower your AI agent to search, read, and create Confluence wiki pages directly from chat.

Databricks
8 toolsManage lakehouse via Databricks — monitor compute clusters, track job executions, audit SQL warehouses, and explore Unity Catalog directly from any AI agent.

Dropbox
8 toolsManage cloud storage via Dropbox — list folders, search files, handle shared links, and monitor space usage directly from any AI agent.

Microsoft Dynamics 365
10 toolsManage accounts, opportunities, orders, and business processes on Microsoft Dynamics 365 — the unified CRM & ERP platform.

GitHub
12 toolsManage repositories, track issues, and search code via AI agents with GitHub.

Gmail
12 toolsManage your inbox from AI — read, search, organize, and reply to emails across your Gmail efficiently.
Google BigQuery
7 toolsEmpower your AI agent to query massive datasets via BigQuery — execute Standard SQL, track active jobs, and inspect table schemas natively.
OpenAI
10 toolsUse GPT-4o, DALL-E 3, embeddings, fine-tuning, and moderation as tools inside your AI agent workflows.

Tesla Fleet API
8 toolsPhysical actuator proxy mapping explicitly native commands evaluating telemetry tracking active Tesla vehicles cleanly.

Groq
8 toolsEmpower LLM applications via Groq — perform ultra-fast LPU-accelerated chat completions, handle audio transcription and translation, and use JSON mode directly from any AI agent.

Home Assistant
15 toolsControl smart home devices and automations via Home Assistant REST API — lights, climate, media, covers, sensors, and more.

LangSmith (LLM Observability & Hub)
6 toolsMonitor LLM apps via LangSmith — track traces, audit prompt templates, and manage evaluation datasets.

LangGraph Cloud (Stateful AI Agents)
10 toolsOrchestrate stateful AI agents via LangGraph Cloud — manage assistants, monitor conversation threads, and handle human-in-the-loop overrides.

Midjourney AI (Generative Image Arts)
10 toolsGenerate professional AI art via Midjourney — use 'imagine' for text-to-image, upscale grids, and perform camera edits.

NVIDIA AI
9 toolsAccess LLMs, embeddings, code generation, and reasoning via NVIDIA API Catalog.

Wolfram Alpha
5 toolsSolve math, science, and engineering queries with computational intelligence.

ArcGIS
10 toolsAutomate mapping and spatial analysis via ArcGIS — perform geocoding, route solving, vehicle routing, and calculate origin-destination matrices from any AI agent.

E2B
3 toolsSecure cloud sandboxes for AI code execution — run Python, JavaScript, and shell commands in isolated Firecracker microVMs with ~150ms cold start.

Airtable
10 toolsConnect your Airtable bases to your AI agent — query records, edit spreadsheets, and build automated workflows naturally via chat.
GitHub
12 toolsManage repositories, track issues, and search code via AI agents with GitHub.

Jira Cloud
10 toolsManage projects, search issues, and track tasks via Jira Cloud API.

Datadog Alternative
16 toolsMonitor infrastructure, APM and logs via Datadog — query metrics, audit monitors, search logs and track incidents from any AI agent.
Docker Hub
10 toolsManage Docker images on Docker Hub — list repositories, browse tags, create repos and search for community images from any AI agent.

GitHub Alternative
14 toolsManage repositories, issues, pull requests and workflows via GitHub — search code, audit commits and track CI/CD from any AI agent.

Notion Alternative
13 toolsManage Notion pages, databases and blocks via API — search content, query databases, create rows and append blocks from any AI agent.

Datadog
11 toolsMonitor applications via Datadog — query performance metrics, search logs, and list active monitors directly from any AI agent.

DigitalOcean
10 toolsEquip your AI agent to manage cloud infrastructure, track Droplets, and monitor managed databases via the DigitalOcean API.

Figma
12 toolsConnect Figma to automate design workflows — inspect files, render layers as images, and manage comments directly from your AI agent.
GitLab
12 toolsManage projects, track issues, and oversee CI/CD pipelines via AI agents with GitLab.
Grafana
4 toolsManage observability via Grafana — search and inspect dashboards, monitor alerts, and handle data sources directly from any AI agent.

Anthropic
10 toolsInteract with Claude models via the Anthropic Messages API — send prompts, manage batches, and monitor rate limits directly.

Cloudflare
25 toolsAI edge infrastructure: manage Workers, KV, D1, R2, routes, and deployments via agents.
Databricks
8 toolsManage lakehouse via Databricks — monitor compute clusters, track job executions, audit SQL warehouses, and explore Unity Catalog directly from any AI agent.
OpenAI
10 toolsUse GPT-4o, DALL-E 3, embeddings, fine-tuning, and moderation as tools inside your AI agent workflows.

Anthropic Alternative
6 toolsAccess Claude models via Anthropic API — send messages, count tokens, manage batches and discover models from any AI agent.

OpenAI Alternative
13 toolsManage OpenAI resources via API — list models, monitor fine-tunes, manage batches and inspect Assistants from any AI agent.

Perplexity AI Alternative
8 toolsAccess Perplexity's AI search and chat models — get web-grounded answers with citations, search the web and run AI conversations from any AI agent.

Azure AI Search
6 toolsExecute RAG queries against Azure AI Search natively — search vectors, full-text documents, and audit cloud indexes directly from your AI agent.

Azure Cognitive Search
7 toolsEmpower your AI with enterprise retrieval — run full-text search, semantic queries, and inspect cognitive skillsets on your Azure indexes.

Amazon Bedrock KB
6 toolsConnect your AI agent to AWS Bedrock Knowledge Bases — execute semantic searches, managed RAG, and sync vector datasources natively.

ClickHouse (Vector Search)
7 toolsManage vector embeddings and SQL via ClickHouse — list databases, execute SQL, and perform high-speed vector searches directly from any AI agent.

Cohere (Embed & Rerank)
6 toolsEmpower RAG via Cohere — generate high-quality text embeddings, rerank documents for better accuracy, and perform AI classification directly from any AI agent.

Bureau of Labor Statistics Full — The Mega Server
5 toolsThe ultimate BLS Mega-Server: Access all 6 major datasets including CPI (Inflation), CES (Jobs), CPS (Unemployment), JOLTS (Turnover), LAUS (Local metrics), and OEWS (Wages by Profession).

EIA Full Access — U.S. Energy Intelligence
34 toolsThe ultimate U.S. energy data Mega-Server: 34 tools covering petroleum, electricity, natural gas, coal, energy forecasts, state data, and international comparisons — every watt, barrel, and BTU from the federal government's energy agency.

Eurostat Full Access — EU Statistical Intelligence
26 toolsThe ultimate EU statistics Mega-Server: 26 tools spanning economy (GDP, inflation, debt), demographics (population, unemployment, migration), trade, environment (emissions, energy, renewables), and 7,000+ dataset discovery — all 27 EU member states.
Home Assistant
15 toolsControl smart home devices and automations via Home Assistant REST API — lights, climate, media, covers, sensors, and more.

Open-Meteo Full Access
15 toolsThe ultimate weather Mega-Server: 15 tools covering forecast, historical (84 years), marine, air quality, pollen, climate projections (to 2100), flood, geocoding, and elevation — all in one zero-auth integration.
Wolfram Alpha
5 toolsSolve math, science, and engineering queries with computational intelligence.

Alexa Smart Home
16 toolsControl Alexa-connected smart home devices — lights, thermostats, speakers, and sensors via Alexa Smart Properties API.

ECB Full — Complete Eurozone Financial Intelligence
14 toolsThe definitive ECB Mega-Server: 14 tools for EUR exchange rates against 40+ currencies, key interest rates (MRO, DFR, MLFR), MFI bank rates, monetary aggregates (M1/M2/M3), government bond yield curves, euro banknotes, and a universal SDMX query engine for all ECB statistical data.

FRED Full Access — U.S. Economic Intelligence
19 toolsThe ultimate U.S. economic data Mega-Server: 19 tools covering time series, releases, categories, regional GeoFRED data, tags, and 107 data sources — 816,000+ series from the Federal Reserve in one integration.
NIST NVD
10 toolsAccess authoritative vulnerability and product data via NIST NVD — track CVEs, CPEs, and security history directly from your AI agent.

NOAA Full — Ultimate Weather & Climate Intelligence
36 toolsThe definitive NOAA Mega-Server: 36 tools spanning weather forecasts, severe alerts, current observations, aviation METARs/TAFs, marine tides and currents, space weather aurora and solar wind, and decades of historical climate records — all from 5 official NOAA APIs.

U.S. Census Full — Complete Demographic & Economic Intelligence
14 toolsThe U.S. Census Mega-Server: 14 tools providing comprehensive access to the ACS and County Business Patterns. Analyze population, age, race, income, poverty, education, home values, rent, and businesses across all 50 states, 3,000+ counties, and cities.

Stripe
13 toolsManage payments, customers, subscriptions, invoices, and account balance via Stripe — all from any AI agent.

Brex
10 toolsEquip your AI to navigate your Brex suite. Spin up virtual cards, route new team members, and check daily cash allocations through natural chat.

Chargebee
10 toolsAutomate recurring billing via Chargebee — manage subscriptions, customers, invoices, and hosted checkouts natively with any AI agent.

Checkout.com
8 toolsManage global payments via Checkout.com — track transactions, process refunds, and monitor account health directly from any AI agent.

Checkout.com
10 toolsManage global payments via Checkout.com — process payments, capture funds, handle refunds, and vault instruments directly from any AI agent.
DocuSign
10 toolsSend documents for signature, manage envelopes, track signing status, and automate contract workflows with AI.

Mercury
10 toolsEquip your AI agent with direct access to Mercury — check account balances, review transactions, and manage recipients without opening the banking dashboard.

PayPal
10 toolsManage e-commerce payments via PayPal — orchestrate orders, process captures securely, issue refunds natively, and structure active subscriptions using AI.

Plaid Enterprise Banking
10 toolsUltimate Open Banking: balances, transactions, ML fraud logic, payroll, and asset verification.
QuickBooks Online
10 toolsConnect QuickBooks to AI — query invoices, manage customers, run financial reports, and automate accounting workflows.

Shopify
12 toolsManage your Shopify store via AI — list products, process orders, search customers, track inventory, and manage discounts from any agent.

Square
10 toolsManage payments, orders, catalog, customers, inventory, locations, and team members for your Square business through natural conversation.
Atlassian (Jira & Confluence)
9 toolsThe ultimate AI bridge for Jira and Confluence — manage projects, agile boards, and wikis via AI.
Cloudflare
25 toolsAI edge infrastructure: manage Workers, KV, D1, R2, routes, and deployments via agents.
GitHub
12 toolsManage repositories, track issues, and search code via AI agents with GitHub.
Jira Cloud
10 toolsManage projects, search issues, and track tasks via Jira Cloud API.

Cloudflare Alternative
15 toolsManage DNS, Workers, KV, Pages and firewall via Cloudflare — audit records, deploy config and inspect CDN analytics from any AI agent.
Docker Hub
10 toolsManage Docker images on Docker Hub — list repositories, browse tags, create repos and search for community images from any AI agent.
GitHub Alternative
14 toolsManage repositories, issues, pull requests and workflows via GitHub — search code, audit commits and track CI/CD from any AI agent.

Bitbucket
10 toolsManage your Git repositories via Bitbucket — list pull requests, commits, and pipelines directly from any AI agent.

CircleCI
8 toolsManage CI/CD pipelines and workflows via CircleCI — track jobs, trigger pipelines, and monitor build status directly from any AI agent.
DigitalOcean
10 toolsEquip your AI agent to manage cloud infrastructure, track Droplets, and monitor managed databases via the DigitalOcean API.

Fivetran
7 toolsManage data movement via Fivetran — monitor connectors and destinations, handle groups, track sync states, and audit users directly from any AI agent.
GitLab
12 toolsManage projects, track issues, and oversee CI/CD pipelines via AI agents with GitLab.
Gmail
12 toolsManage your inbox from AI — read, search, organize, and reply to emails across your Gmail efficiently.

Instagram (Social Media & Business)
10 toolsManage your Instagram presence via AI — publish photos and reels, analyze insights, and manage comments.

Slack
6 toolsAutomate Slack messaging — send messages, search conversations, list channels and users directly from any AI agent.
Slack Bot
10 toolsControl and manage your Slack workspace — audit channels, messages, and users via AI.

Discord
10 toolsManage communities via Discord — list server channels and members, send and edit messages, and handle channel moderation directly from any AI agent.

Intercom
10 toolsEquip your AI agent with direct access to Intercom — manage conversations, search contacts, and track customer data without opening the Intercom inbox.

Nylas
10 toolsEquip your AI agent to manage emails, calendars, and contacts across all providers (Gmail, Outlook) through a single unified interaction.

Twilio
10 toolsAutomate communication workflows via Twilio — manage SMS messaging, voice calls, call recordings, and account usage directly from any AI agent.

WhatsApp Business
6 toolsSend text, media, and interactive messages on WhatsApp — the world's most popular messaging platform.

Zendesk
9 toolsManage support tickets, users, and organizations on Zendesk — the complete customer service platform for high-scale teams.

Zoom
10 toolsManage video meetings, webinars, and users on Zoom — the world's leading collaboration and communication platform.

Discord Bot
10 toolsControl and manage your Discord bots — audit guilds, channels, and messages via AI.
X Ads (Twitter)
8 toolsManage your X Ads campaigns — audit accounts, line items, and analytics via AI.
Airtable
10 toolsConnect your Airtable bases to your AI agent — query records, edit spreadsheets, and build automated workflows naturally via chat.
Instagram (Social Media & Business)
10 toolsManage your Instagram presence via AI — publish photos and reels, analyze insights, and manage comments.

Mailchimp
10 toolsSynchronize marketing contacts — list audiences, control subscriber limits, and edit campaign vectors autonomously.

ActiveCampaign
5 toolsMarketing automation and CRM — manage contacts, deals, lists, and automations via AI.

Ahrefs
10 toolsProfessional SEO intelligence — audit backlinks, keywords, and domain health via AI.

Clearbit (HubSpot)
8 toolsEnrich person and company data via Clearbit — track leads, monitor firmographics, and audit B2B intelligence directly from any AI agent.

Facebook Ads
12 toolsManage your Facebook and Meta Ads via AI — list campaigns, track performance insights, and update ad status directly through your agent.

Google Ads
8 toolsEquip your AI agent with direct access to Google Ads — manage search, display, and shopping campaigns, track conversions, and optimize ad spend without opening the Google Ads console.

Make (Workflow Automation)
7 toolsManage workflow automation via Make — audit scenarios, track execution logs, and monitor data stores.

Meta Ads
10 toolsEquip your AI agent with direct access to Meta Ads — manage Facebook and Instagram campaigns, track ad performance, and optimize spend without opening Meta Ads Manager.
Zapier
6 toolsMonitor automated workflows, audit app connections, and search for Zap templates on Zapier — the leader in AI orchestration.
Confluence
8 toolsEmpower your AI agent to search, read, and create Confluence wiki pages directly from chat.
Databricks
8 toolsManage lakehouse via Databricks — monitor compute clusters, track job executions, audit SQL warehouses, and explore Unity Catalog directly from any AI agent.

Snowflake
7 toolsBring your absolute data cloud into your AI editor. Execute queries, list warehouses, and map complex schemas natively.
Airbyte
7 toolsMonitor your Airbyte data pipelines via AI — track sync jobs, list sources, and check connections instantly.
Bureau of Labor Statistics Full — The Mega Server
5 toolsThe ultimate BLS Mega-Server: Access all 6 major datasets including CPI (Inflation), CES (Jobs), CPS (Unemployment), JOLTS (Turnover), LAUS (Local metrics), and OEWS (Wages by Profession).

Bureau of Labor Statistics Full — The Mega Server
1 toolsThe ultimate BLS Mega-Server: Access all 6 major datasets including CPI (Inflation), CES (Jobs), CPS (Unemployment), JOLTS (Turnover), LAUS (Local metrics), and OEWS (Wages by Profession).
ClickHouse (Vector Search)
7 toolsManage vector embeddings and SQL via ClickHouse — list databases, execute SQL, and perform high-speed vector searches directly from any AI agent.
Datadog AI (LLM Observability)
10 toolsMonitor LLM performance via Datadog — track token usage, audit prompts, and monitor AI model metrics directly from any AI agent.
EIA Full Access — U.S. Energy Intelligence
34 toolsThe ultimate U.S. energy data Mega-Server: 34 tools covering petroleum, electricity, natural gas, coal, energy forecasts, state data, and international comparisons — every watt, barrel, and BTU from the federal government's energy agency.

Elastic Enterprise Search
6 toolsManage enterprise search via Elastic — search engines and documents, handle indexing, and monitor search analytics directly from any AI agent.
Elasticsearch Vector
6 toolsEmpower vector search via Elasticsearch — perform dense vector kNN searches, handle index mappings, and index embedding documents directly from any AI agent.
Fivetran
7 toolsManage data movement via Fivetran — monitor connectors and destinations, handle groups, track sync states, and audit users directly from any AI agent.
Amazon S3
10 toolsCloud object storage orchestration — manage buckets, objects, and metadata via AI.

Auth0
10 toolsManage IAM operations—users, clients, connections, and logs in your Auth0 tenant directly via your AI agent.
Brex
10 toolsEquip your AI to navigate your Brex suite. Spin up virtual cards, route new team members, and check daily cash allocations through natural chat.
Checkmarx
10 toolsAutomate AppSec via Checkmarx One — trigger core scans, analyze vulnerabilities, discover Best Fix Locations (BFL), and monitor KICS results.

Clerk
8 toolsManage authentication and users via Clerk — track active sessions, monitor organizations, and manage invitations directly from any AI agent.

CyberArk Privilege Cloud
10 toolsManage privileged access via CyberArk — audit secure safes, checkout vaulted account passwords, monitor users, and terminate sessions directly from any AI agent.
Plaid Enterprise Banking
10 toolsUltimate Open Banking: balances, transactions, ML fraud logic, payroll, and asset verification.

Snyk
9 toolsBring your Snyk code security ecosystem directly to your AI. Analyze vulnerabilities, project metadata, and scan issues right from your editor.

Auth0 Alternative
13 toolsManage identity and access via Auth0 — list users, create accounts, audit logs, manage clients and review connections from any AI agent.

Doppler
12 toolsManage secrets and environment variables via Doppler — list projects, audit secrets, and track activity logs from any AI agent.

Black Duck (Synopsys)
10 toolsSecure your open source supply chain via Black Duck — list projects, versions, and vulnerabilities directly from any AI agent.

Firecrawl
4 toolsTurn any website into clean, LLM-ready Markdown with a single API call — scrape, crawl, search, and map the entire web for your AI agent.
LangSmith (LLM Observability & Hub)
6 toolsMonitor LLM apps via LangSmith — track traces, audit prompt templates, and manage evaluation datasets.

Langfuse (LLM Tracing & Evals)
10 toolsMonitor LLM apps via Langfuse — track traces, manage prompt templates, and audit evaluation scores.
LangGraph Cloud (Stateful AI Agents)
10 toolsOrchestrate stateful AI agents via LangGraph Cloud — manage assistants, monitor conversation threads, and handle human-in-the-loop overrides.

LangSmith
3 toolsObservability and evaluation platform for LLM applications — monitor traces, debug agent runs, and track performance metrics across your AI stack.

LlamaIndex (AI Data Framework & RAG)
6 toolsQuery and manage RAG pipelines via LlamaIndex — execute natural language searches, audit indexed files, and monitor data pipelines.
Make (Workflow Automation)
7 toolsManage workflow automation via Make — audit scenarios, track execution logs, and monitor data stores.

Mem0
4 toolsGive your AI agent persistent memory — store, search, and recall facts, preferences, and context across sessions using the leading agent memory platform.
Zapier
6 toolsMonitor automated workflows, audit app connections, and search for Zap templates on Zapier — the leader in AI orchestration.

Apify Alternative
10 toolsManage your cloud automation — audit actors, tasks, and datasets via AI.

Apify
10 toolsCommand Apify scrapers from your AI agent — run actors, extract web data, poll datasets, and automate browser tasks seamlessly.

Composio Smart Home
8 toolsAccess 1000+ smart home tool integrations via Composio API — control devices through structured arguments or natural language commands.
Datadog Alternative
16 toolsMonitor infrastructure, APM and logs via Datadog — query metrics, audit monitors, search logs and track incidents from any AI agent.
Datadog AI (LLM Observability)
10 toolsMonitor LLM performance via Datadog — track token usage, audit prompts, and monitor AI model metrics directly from any AI agent.
Datadog
11 toolsMonitor applications via Datadog — query performance metrics, search logs, and list active monitors directly from any AI agent.
Grafana
4 toolsManage observability via Grafana — search and inspect dashboards, monitor alerts, and handle data sources directly from any AI agent.
LangSmith (LLM Observability & Hub)
6 toolsMonitor LLM apps via LangSmith — track traces, audit prompt templates, and manage evaluation datasets.
Langfuse (LLM Tracing & Evals)
10 toolsMonitor LLM apps via Langfuse — track traces, manage prompt templates, and audit evaluation scores.
LangSmith
3 toolsObservability and evaluation platform for LLM applications — monitor traces, debug agent runs, and track performance metrics across your AI stack.
New Relic AI (LLM Observability)
10 toolsMonitor and audit LLM telemetry via New Relic AI — track token costs, p95 latency, and user feedback.

New Relic
10 toolsMonitor and query your entire stack via New Relic NerdGraph — track entities, NRQL, and alerts directly from your AI agent.
Sentry Alternative
15 toolsMonitor errors and application health via Sentry — query issues, inspect events, audit releases and check alert rules directly from any AI agent.
BrowserStack
10 toolsAutomate testing via BrowserStack — manage projects, track test builds, fetch session logs, and monitor execution pipelines from any AI agent.
BugSnag
10 toolsMonitor application errors via BugSnag — track stability, inspect error groups, and retrieve event details directly from any AI agent.

Checkly
8 toolsManage application monitoring and E2E testing via Checkly — track API uptime, trigger checks, and monitor performance directly from any AI agent.

Elastic Security
10 toolsManage SIEM and SOC operations via Elastic Security — monitor detection rules, search security alerts (Signals), handle whitelisting, and audit threat coverage directly from any AI agent.

Helicone (LLM Observability)
10 toolsMonitor LLM usage via Helicone — track requests, analyze costs, measure latency, and manage prompts.

Lacework (Cloud Security & CNAPP)
10 toolsSecure your cloud via Lacework — search security alerts, monitor vulnerabilities, and audit cloud asset inventory.

Portkey
10 toolsAI gateway observability: monitor logs, costs, and manage LLM configurations via agents.

Sumo Logic
9 toolsConnect your AI to Sumo Logic. Orchestrate log searches, monitor active collectors, and analyze system events efficiently.

Trend Micro
8 toolsEquip your AI agent with Vision One telemetry to investigate threats, audit endpoint activities, and manage security alerts natively.
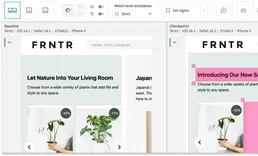
Applitools
10 toolsBring AI-powered visual testing to your AI agent — inspect test batches, review UI diffs, and manage your visual baselines naturally.

Better Stack
10 toolsMonitor uptime and incidents via Better Stack — list monitors, heartbeats, and on-call schedules directly from any AI agent.

Better Stack
10 toolsAutomate incident management via Better Stack — monitor uptime, manage incidents, and control on-call schedules securely from your AI agent.

BlazeMeter
10 toolsAutomate continuous performance testing via BlazeMeter — manage workspaces, trigger load tests, and analyze active run metrics securely via AI.

Checkmk
8 toolsManage IT infrastructure monitoring via Checkmk — track hosts, monitor services, and activate changes directly from any AI agent.

Cisco Meraki
8 toolsManage cloud-managed networking via Cisco Meraki — track devices, monitor clients, and audit network health directly from any AI agent.

Cypress Cloud
10 toolsAudit E2E testing via Cypress — monitor test runs, inspect spec instances, track flaky tests, and generate enterprise reports directly from any AI agent.

Everbridge Critical Management
10 toolsEquip your AI agent to manage critical notifications, track incidents, and monitor contacts via the Everbridge API.

Honeycomb
12 toolsAutomate observability via Honeycomb — manage datasets, queries, and markers directly from any AI agent.

Incident.io
10 toolsManage incidents, roles, and on-call schedules via Incident.io API.

Grafana k6 Cloud (Load Testing)
10 toolsManage load tests via k6 Cloud — run tests, monitor performance metrics, and audit thresholds.

Kaseya
10 toolsManage IT infrastructure, devices, and automation via Kaseya VSA 10.

TestMu AI (formerly LambdaTest)
10 toolsManage cross-browser testing via TestMu AI — audit automation builds, inspect test sessions, and retrieve visual logs.

Cisco Meraki
10 toolsCloud-managed IT via Cisco Meraki — track networks, devices, and client connectivity.

Nmap Online
10 toolsPerform network discovery and security auditing via Nmap — track port scans, DNS lookups, and traceroutes directly from your AI agent.

NOAA Alerts — US Severe Weather Warnings
4 toolsReal-time NWS severe weather alerts: tornado warnings, hurricane watches, flood advisories, winter storms, and 120+ alert types filtered by state, zone, or exact location across the United States.

NVIDIA NIM
8 toolsMLOps proxy unifying explicitly local hardware limits extracting telemetry across active NVIDIA AI containers.

Rapid7 InsightVM
10 toolsEquip your AI to interact directly with Rapid7 InsightVM, extracting vulnerability assessments, scanning network assets, and launching immediate scans.

Rollbar
10 toolsConnect your AI assistant to Rollbar to identify active bugs, review stack traces, trace code deployments, and manage error lifecycles without leaving the chat.